Can policy uncertainty explain the vibecession?
Drafted by Claude Code from an analysis I directed and reviewed.
The “vibecession” has a precise definition in Matt Darling’s The Vibecession Hasn’t Gone Away, and it is a residual. Take the historical relationship between consumer sentiment and three ordinary macro variables — unemployment, inflation and interest rates — and estimate it using only data from before Covid. Then feed the model what actually happened since, and ask what sentiment it would have predicted. The vibecession is the difference between what people report and what the fundamentals say they should report. It is not the claim that sentiment is low, which would be unremarkable in 2022 when inflation was 9%. It is the claim that sentiment is lower than the economy can account for, and that the shortfall has persisted long after inflation came down.
Run that way, the gap is currently about 40 points, and it has widened rather than closed as inflation normalised. The five worst months in the entire 1978-2026 record all fall in 2025 and 2026; the worst month before Covid was November 2008, at -28.5 points, which 2025-26 clears by a wide margin.
Two candidate explanations have been proposed for at least part of it, and this post tests both.
The first is that the measuring instrument changed. The University of Michigan moved its survey from telephone to web between April and July 2024, and web respondents rate the economy worse than comparable phone respondents. The second is that something genuinely unusual happened to the economic environment that the three macro variables do not capture: policy uncertainty reached levels in 2025-26 with no precedent in forty years of data.
Both turn out to account for a meaningful share. If I model the mode change as a permanent level shift of roughly nine index points, this removes about a quarter of the gap. Policy uncertainty accounts for a further chunk. I estimate that together they cover roughly half of the 2025-26 gap. Macroeconomic forecast uncertainty and stock-market volatility account for essentially none of it, because neither is elevated in 2025-26 at all.
What needs explaining
Darling’s specification adds one term to the three macro variables: a pre-1983 indicator, which accounts for the change in CPI housing measurement that makes older inflation readings not directly comparable with modern ones.
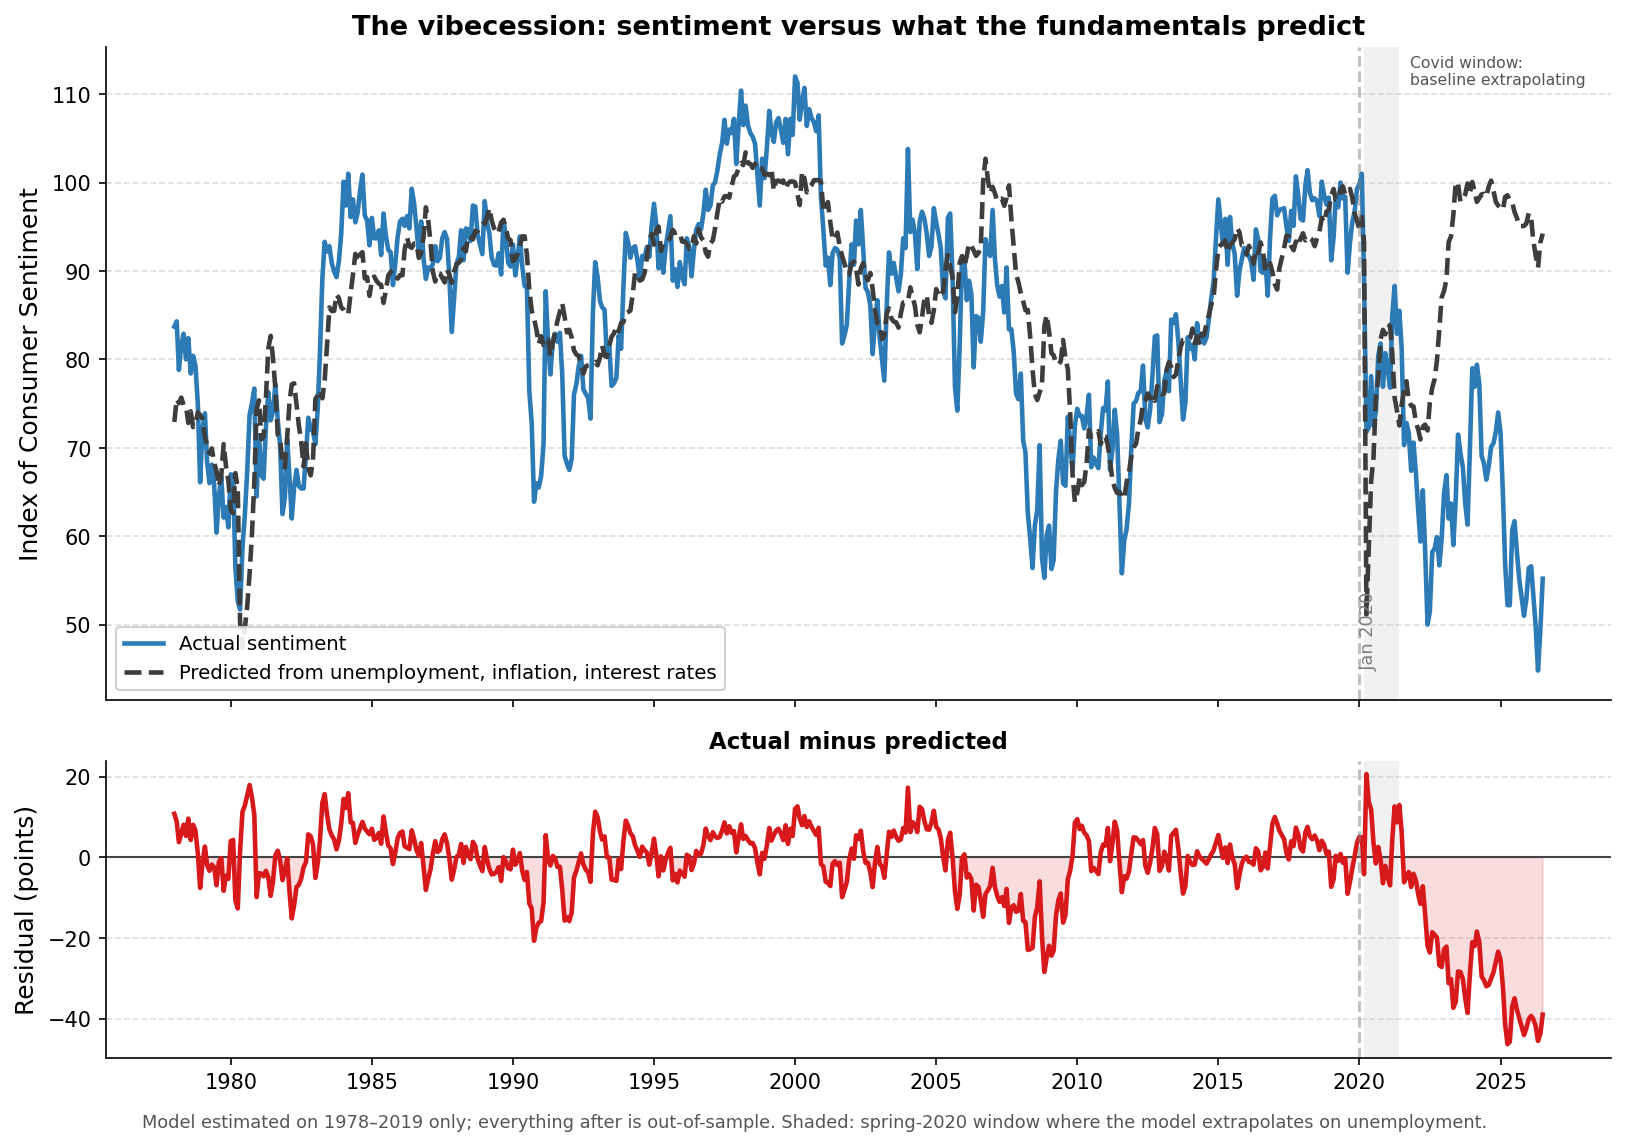
Estimated on monthly data from 1978 through December 2019 (n=504, R²=0.68), the model tracks sentiment reasonably closely for four decades. Everything after January 2020 is out-of-sample. The gap opens in early 2022 and averages -12.5 points over the 2021-22 inflation surge, -28.5 points through 2023-24, and -39.9 points from January 2025 onward. April 2025 is the single largest negative residual at -46.4 points; March 2026 is -40.1, against the roughly 40 points Darling reports.
The survey changes
Michigan began moving the Survey of Consumers from telephone to web in April 2024 and completed the transition in July. Web respondents consistently rate the economy worse than demographically comparable phone respondents; Nate Silver’s discussion puts the persistent downshift at almost nine index points. This cannot be estimated inside Michigan’s own data, where the mode change is nearly collinear with the 2025-26 period itself.
It can be estimated from outside. The New York Fed’s Survey of Consumer Expectations launched in June 2013 as an online panel and has never changed modes, so any abrupt divergence between the two surveys at exactly the transition date is a reading on the mode effect.
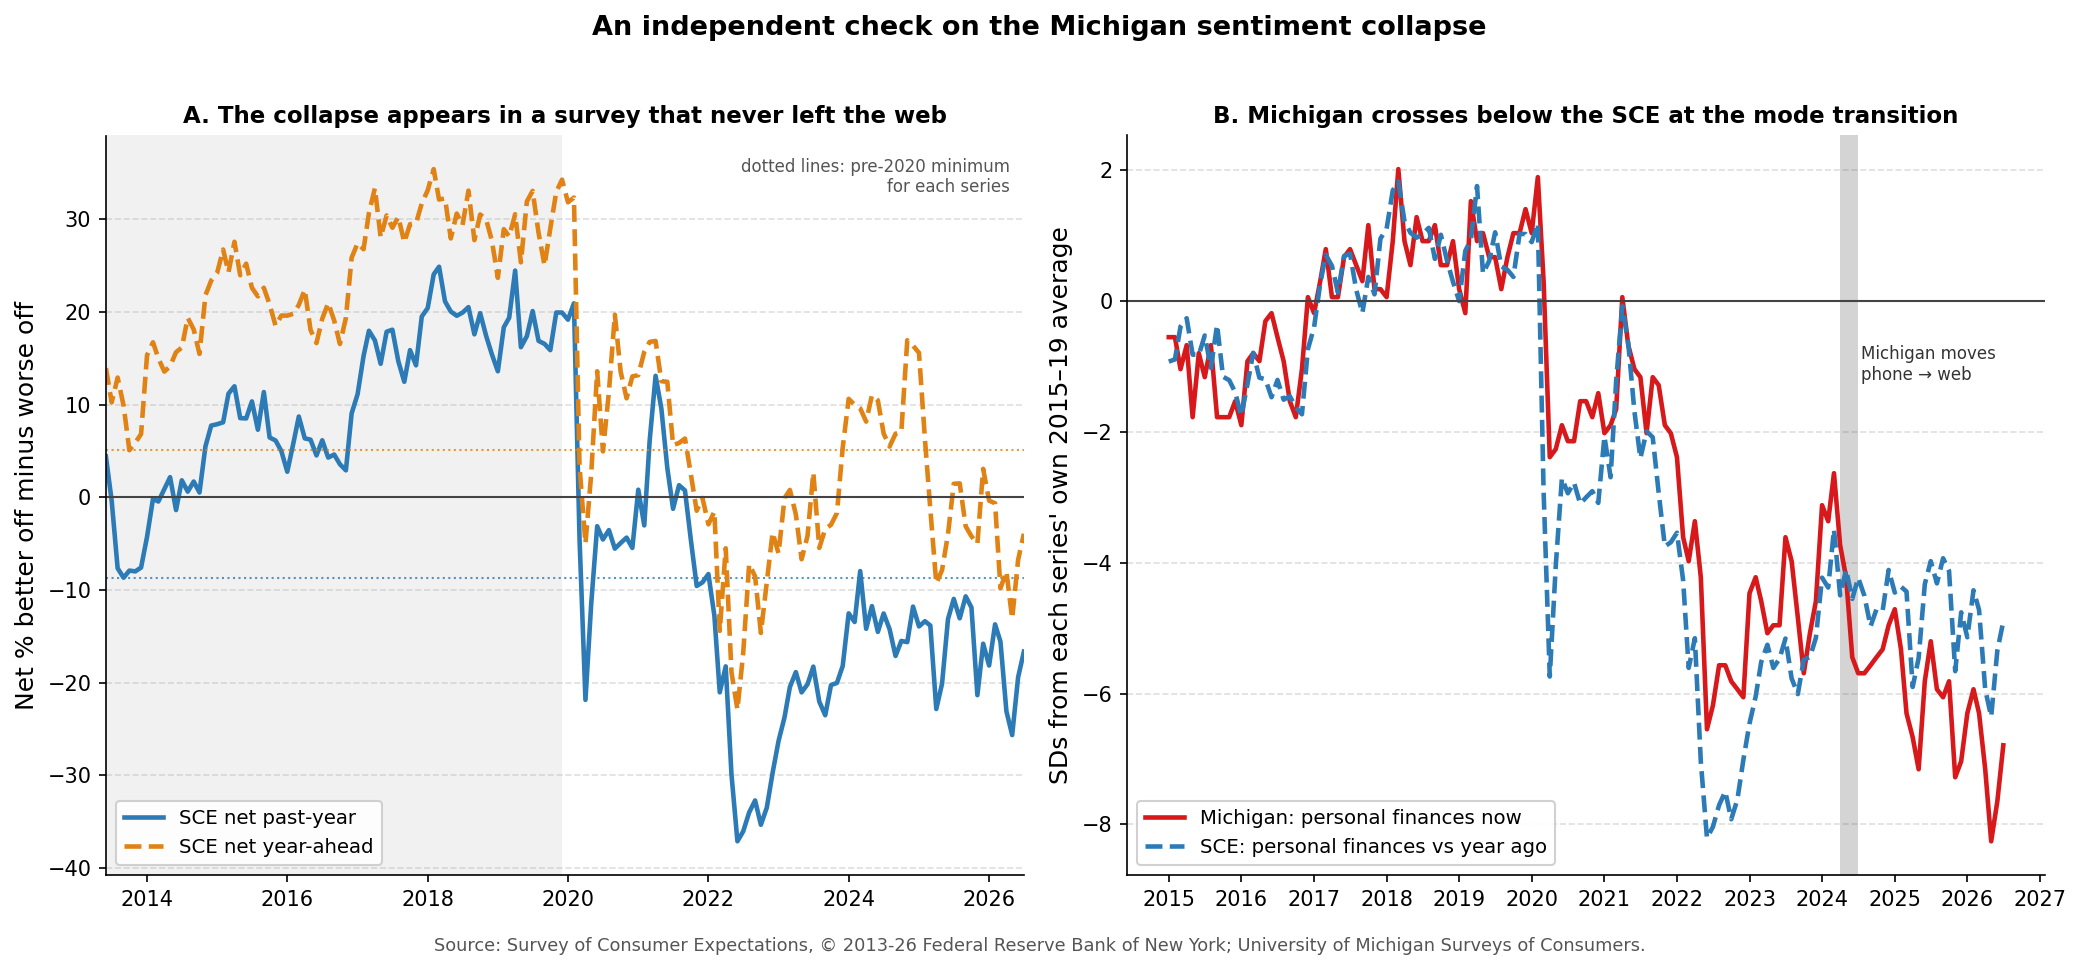
Michigan’s headline sentiment index ran more optimistic than the SCE’s measure through 2020-2023, by an average of 0.23 standard deviations. From July 2024 it runs 0.52 standard deviations more pessimistic. The break is 0.75 standard deviations, or 8.7 index points measured against the SCE’s past-year question and 9.7 points against its year-ahead question — arrived at independently, and close to the nine points reported elsewhere.
That figure is an upper bound rather than a point estimate, because it credits the mode change with the entire divergence between two surveys that ask different questions of different samples. But it is the right order of magnitude, and I take the mode effect as real for the rest of this post.
A level shift cannot be the whole story
A one-time downward step has a specific and limited footprint. It arrived in mid-2024. The vibecession did not.
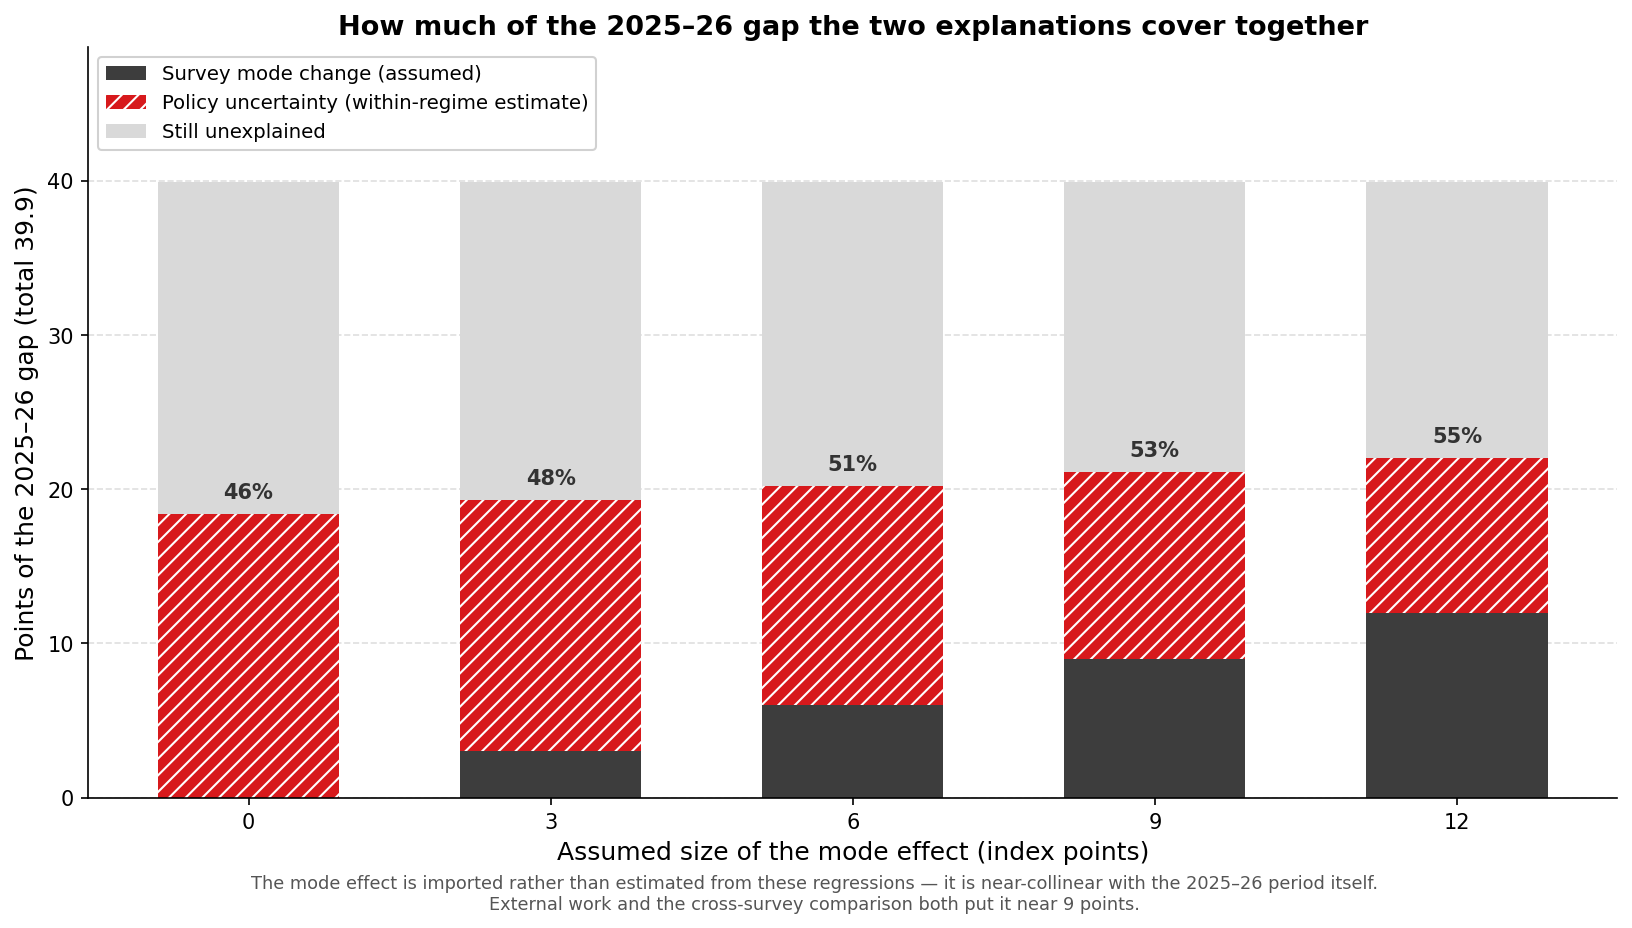
Subtracting a nine-point mode effect leaves a 2025-26 gap of -30.9 points rather than -39.9. It leaves the 2021-22 gap entirely untouched, because that period is wholly phone-era. It moves the 2023-24 gap from -28.5 to -25.9, because only 29% of that period falls after the transition began. And 2023 on its own — entirely phone-era — already averages -30.8 points. A gap that size opens up in the data more than a year before Michigan changed anything about how it collected responses.
Policy uncertainty is outside its historical range
If the mode shift can explain a 9-point gap, what explains the rest? One possibility is uncertainty about the future. Three widely used indices try to capture that, and they measure quite different things.
The Jurado-Ludvigson-Ng index measures how hard macroeconomic variables actually are to forecast — statistical unpredictability. The Baker-Bloom-Davis index counts newspaper articles about economic policy uncertainty, so it captures the policy environment and the news environment together. The VIX measures what options markets charge for near-term equity volatility. A month can score high on one and low on another: a well-understood recession can be easy to forecast and heavily covered, while a quiet market can coexist with chaotic policy.
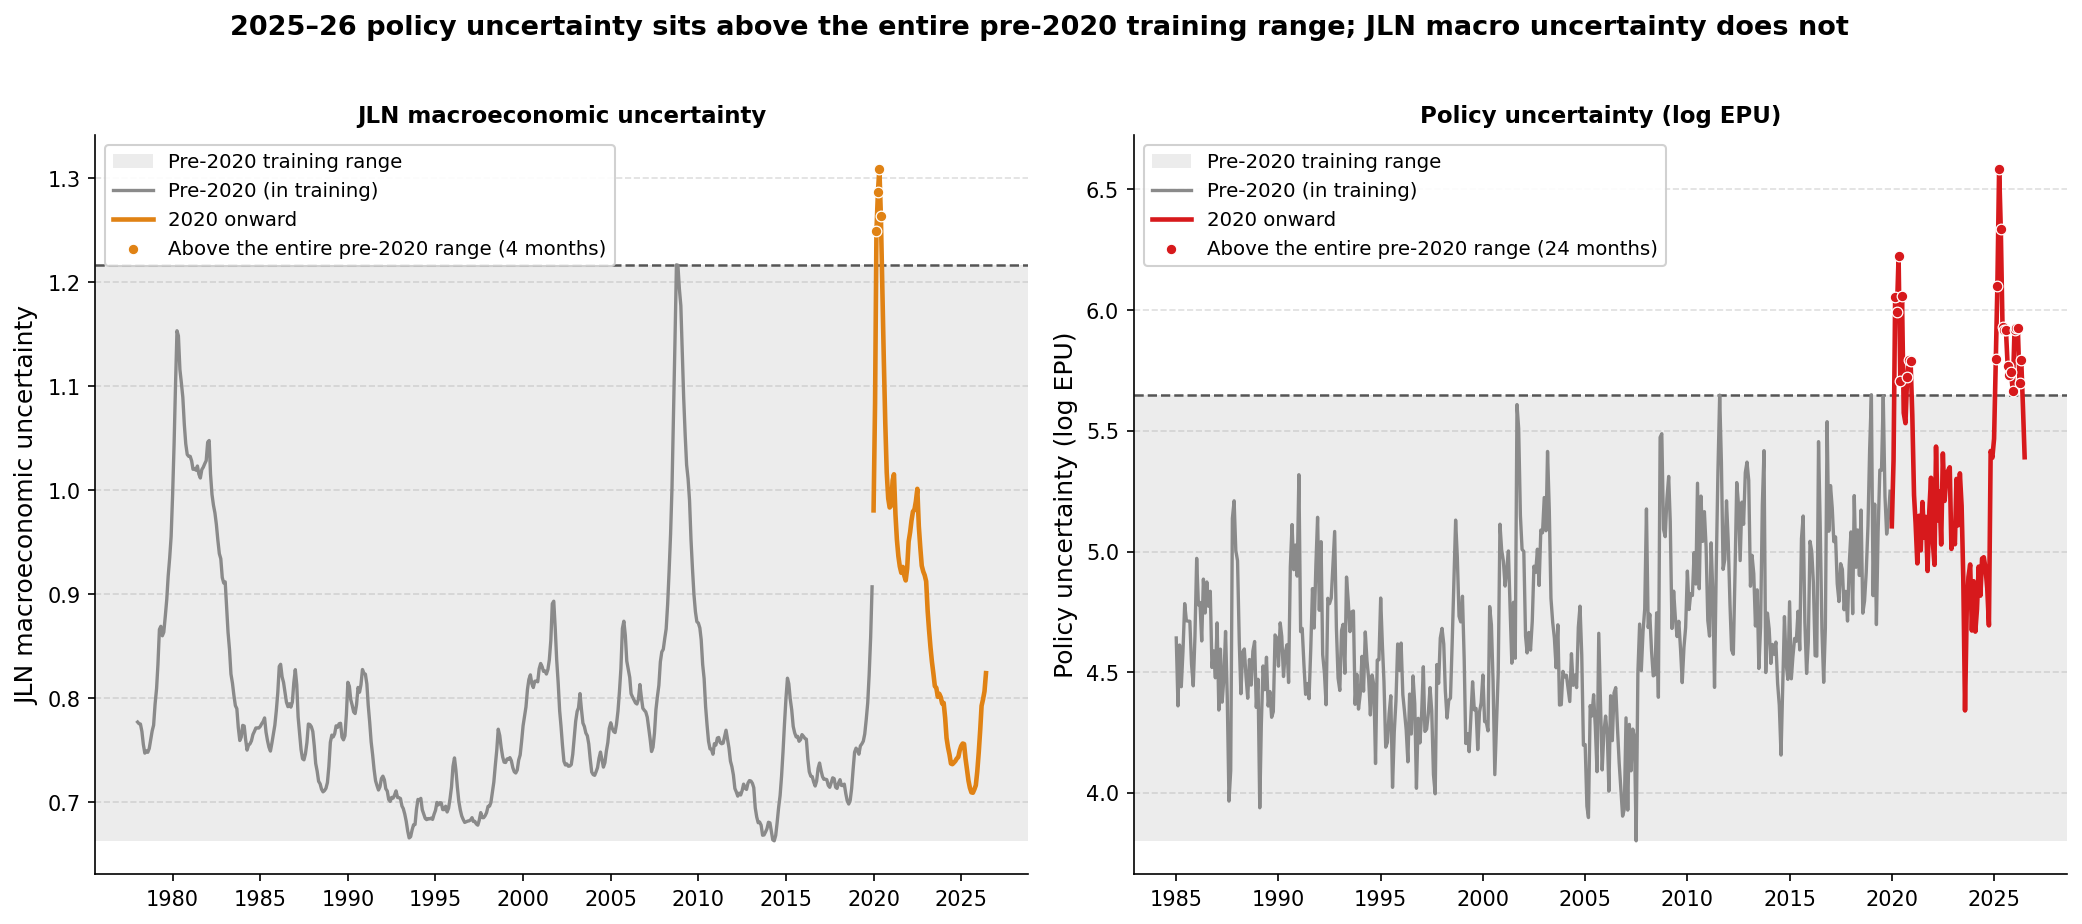
Only one of these measures is unusual in 2025-26. In the Baker-Bloom-Davis index, sixteen of nineteen months of policy uncertainty sit above the entire pre-2020 maximum, 3.4 standard deviations above the pre-2020 mean in logs. In contrast, Jurado-Ludvigson-Ng’s macroeconomic forecast uncertainty index is 0.34 standard deviations below its pre-2020 mean, with no month above the pre-2020 range; the VIX is 0.11 standard deviations above, also with no month outside its range. Whatever 2025-26 is, it is not a period in which the macroeconomy became hard to forecast, and it is not a period of unusual market volatility.
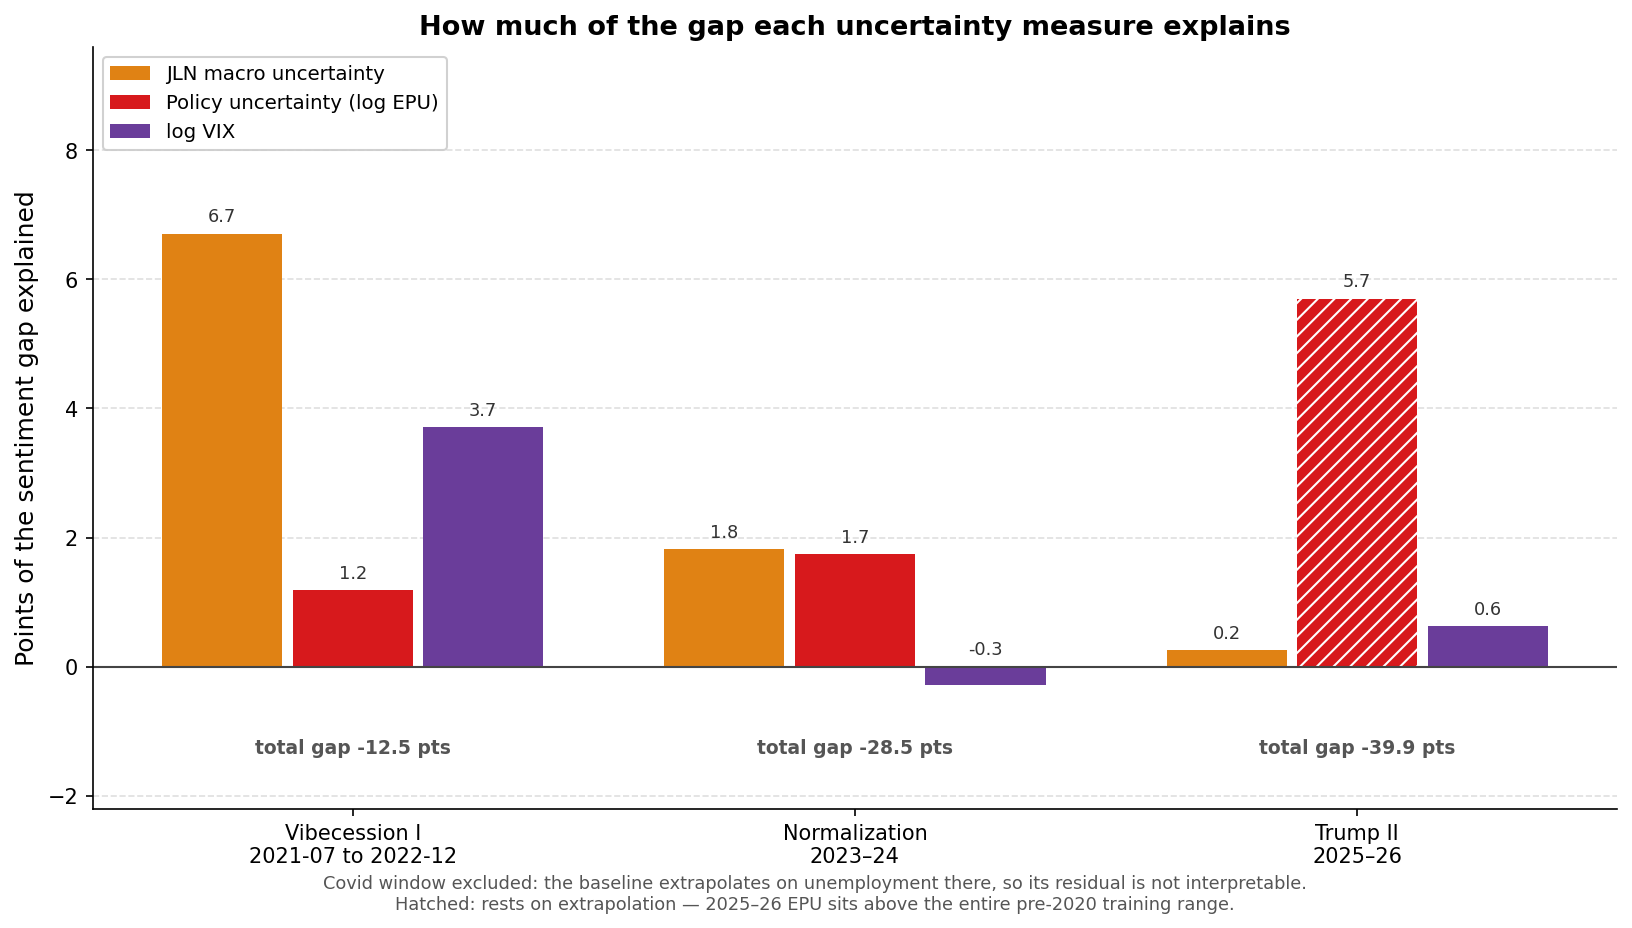
I start by following the same approach Darling took with his original post that linked sentiment to macro variables, adding each measure to the baseline one at a time, but training only through 2019. We then use the resulting relationship to forecast what sentiment would be predicted to be after 2020. Over the 2021-22 inflation surge, macro uncertainty closes 6.7 of the 12.5-point gap (54%) and the VIX closes 3.7 points (28%), while policy uncertainty closes 1.2 points (11%). Through 2023-24 nothing works: no single measure closes more than 8%. From 2025 the pattern reverses — policy uncertainty closes 5.7 points (14% of the raw gap, 18% of the mode-adjusted one) while macro uncertainty closes 0.2 points and the VIX 0.6.
I think there are three potential issues with this approach. First, in contrast to macro variables, policy uncertainty moved well outside historical ranges after 2020. I worry this might have broken the historical relationship - for example, people may pay closer attention to policy uncertainty, in eras when it is regularly setting records. Second, it is possible the mode shift may have interacted with policy uncertainty. Lastly, this approach is also sensitive to how the projection is done: in levels rather than logs it becomes 27%, and stripping policy uncertainty’s long-run upward drift takes it to 10%.
The relationship holds in a survey that never switched modes
A way around the extrapolation problem is to estimate the relationship within the post-2020 period, where policy uncertainty varies over a wide range. That never extrapolates, but it gives up the out-of-sample discipline, and in Michigan it is contaminated by the mode step. The SCE resolves both problems at once.
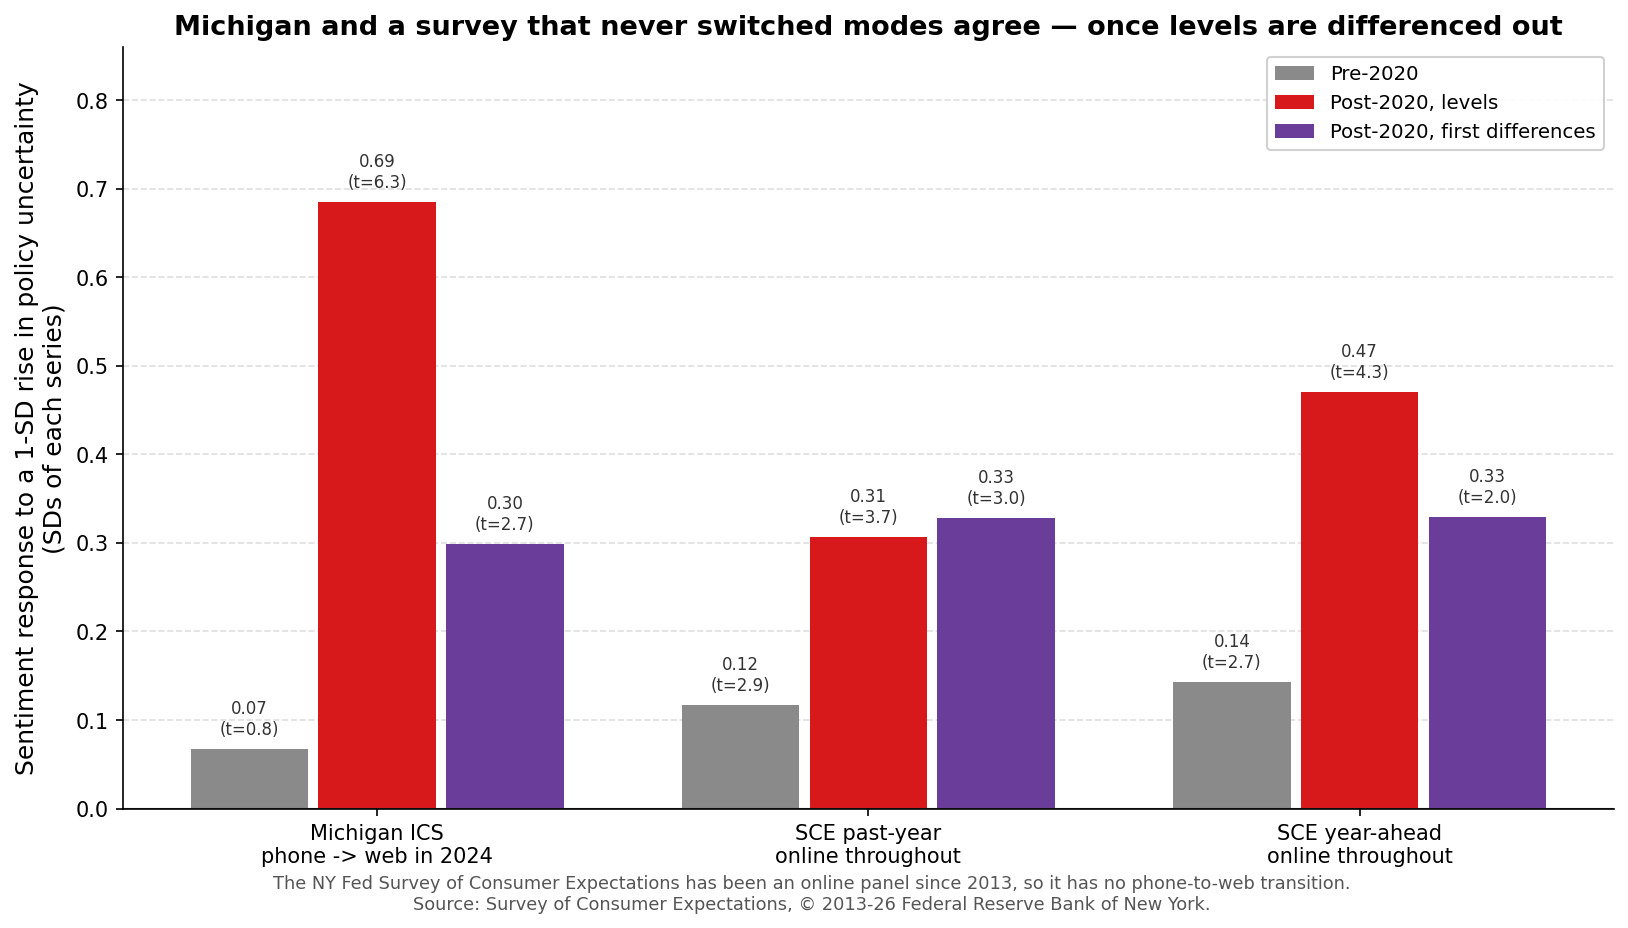
In levels, Michigan’s response to a one-standard-deviation rise in policy uncertainty is 0.69 standard deviations, against 0.31 and 0.47 for the SCE’s two measures — Michigan is roughly twice as responsive, which is what a Michigan-only level shift would produce. In first differences the three converge: 0.30, 0.33 and 0.33, all significant. Once the level shift is removed, the survey that changed modes and the survey that did not agree almost exactly on how much policy uncertainty moves sentiment.
Both surveys also show the relationship strengthening after 2020. Comparing levels with levels, the SCE’s response roughly triples, from 0.12 to 0.31 for the past-year question and from 0.14 to 0.47 for the year-ahead question.
Applying the within-regime estimate, policy uncertainty accounts for around 12 points of the mode-adjusted 30.9-point gap. Together with the nine points attributed to the mode change, that is roughly half of the original 39.9.
Why the relationship might have strengthened
One hypothesis is salience: policy uncertainty reached levels that commanded much more attention, so a given amount of it moved sentiment more than it used to. That is a hypothesis and these data cannot prove it, but it has an observable implication. Michigan asks respondents what news they recall hearing about business conditions, unprompted — survey recall rather than newspaper text, generated quite differently from the policy uncertainty index.
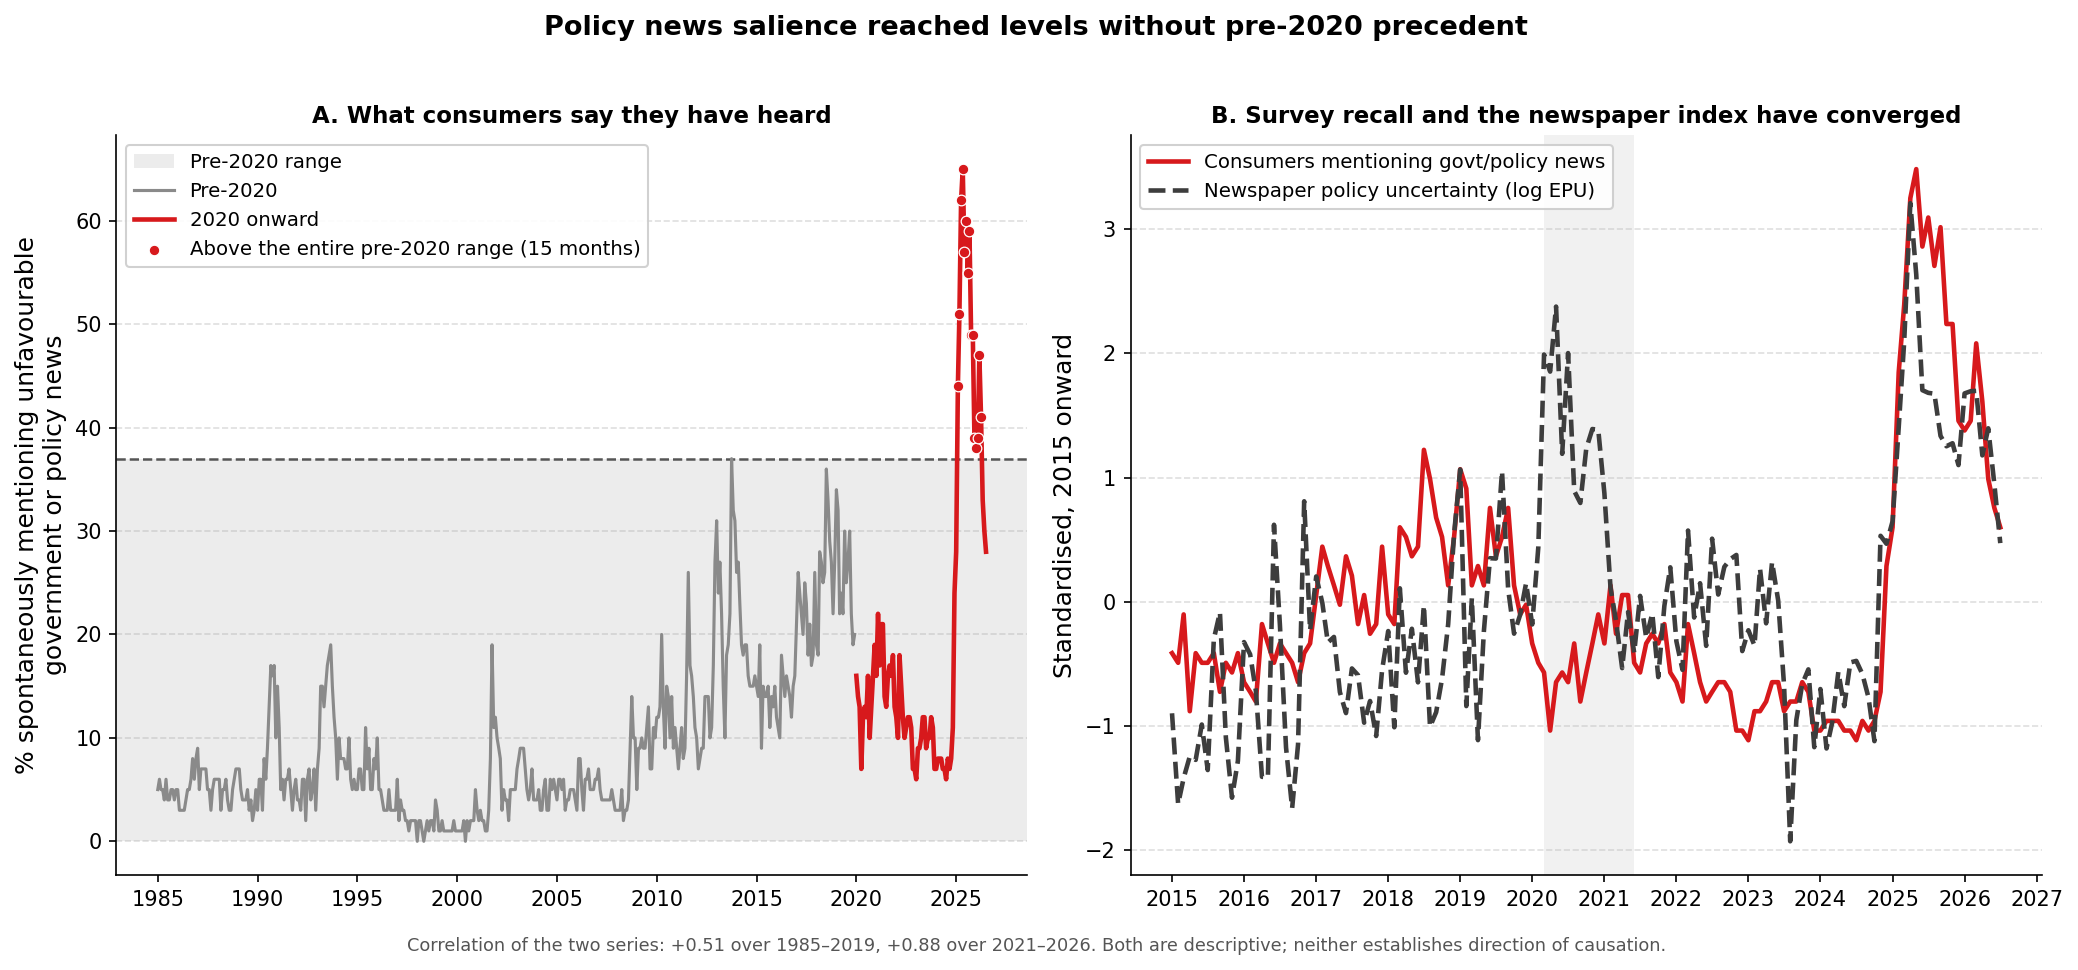
The share spontaneously mentioning unfavourable government or policy news averaged 9.1% from 1985 to 2019 and never once exceeded 37% in forty years, a peak set during the October 2013 shutdown. It averaged 11.8% over 2021-24. From January 2025 it averages 46.0% and peaks at 65%, with fifteen of nineteen months above the pre-2020 maximum. The share saying the government is doing a poor job on economic policy rose from a 1985-2019 average of 29.6% to 64.7%. The correlation between what consumers report hearing and the newspaper-based index rises from +0.51 over 1985-2019 to +0.88 over 2021-26.
Two caveats. This measure comes from the same survey as the sentiment data, so it inherits the same mode change, though the timing does not fit — it runs between 6% and 11% from January to November 2024 and only breaks upward in December, five months after the transition completed. And consumers who already feel bad may recall more bad government news, so the direction of causation is not established.
The partisan composition objection
As documented in the Silver Bulletin, alongside the mode change, Michigan’s sample became more Democratic after 2024, and the partisan gap in reported sentiment widened to roughly 53 points. A reasonable objection is that the 2025-26 deterioration is partly a compositional artifact rather than a change in what Americans think. If policy uncertainty genuinely depresses sentiment and reached unprecedented levels, that is a candidate mechanism for why the partisan gap widened beyond what earlier changes in party control produced — not a rival explanation to composition, but a reason the composition effect might be larger this time. Distinguishing that from expressive partisan responding needs a partisan breakdown this analysis does not have.
What is still unexplained
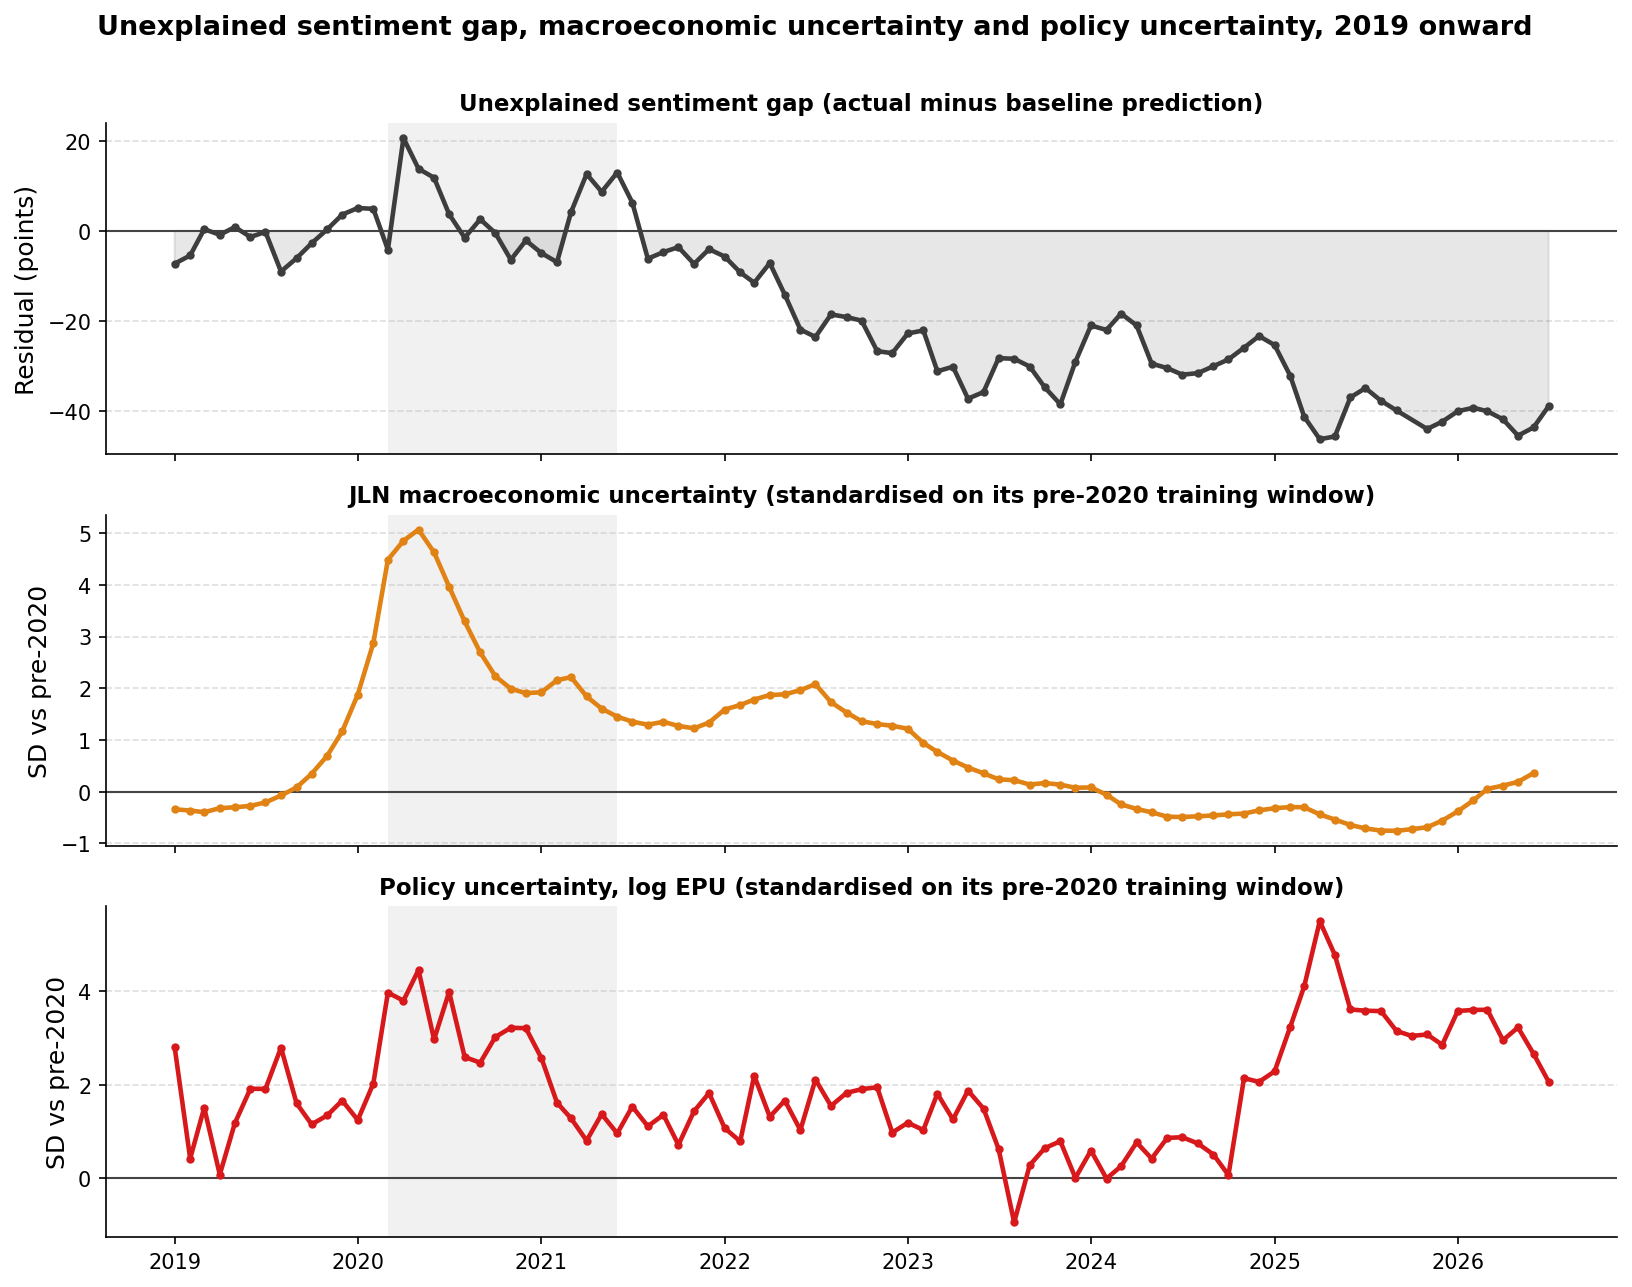
Macro uncertainty spikes in 2020, subsides through 2022, and sits at or below its pre-2020 average from 2024 onward. Policy uncertainty is unremarkable through 2021-24 and spikes from early 2025. The 2023-24 stretch, where the gap averages -28.5 points, has neither: every uncertainty measure is at an ordinary level throughout, and the mode change accounts for at most 2.6 points of it. That period remains the clearest gap in this account, and it is the reason neither explanation offered here can be scaled up to cover the whole phenomenon.
Data
Consumer sentiment, its components, and the share of respondents spontaneously recalling unfavourable government or policy news are monthly series from the University of Michigan Surveys of Consumers data archive, 1978-01 to 2026-07. The independent benchmark is the New York Fed Survey of Consumer Expectations, an online panel since June 2013. Unemployment (UNRATE), CPI (CPIAUCSL), the effective federal funds rate (FEDFUNDS), Jurado-Ludvigson-Ng 3-month macroeconomic uncertainty (JLNUM3M), the Baker-Bloom-Davis news-based Economic Policy Uncertainty index (USEPUNEWSINDXM) and the VIX (VIXCLS) come from FRED; the VIX is averaged to monthly means of daily closes. Inflation is the 12-month change in CPI. There is no October 2025 CPI or unemployment rate — the BLS did not publish during the 2025 federal shutdown — so that month drops out rather than being interpolated. Darling does not specify his interest-rate series, so the federal funds rate is used here and is not presented as his specification; a 30-year mortgage rate is run as a robustness check. All standard errors are Newey-West with 12 lags. These are highly autocorrelated time-series regressions and the exercise is descriptive, not a causal design.
Source: Survey of Consumer Expectations, © 2013-26 Federal Reserve Bank of New York (FRBNY). The SCE data are available without charge at www.newyorkfed.org and may be used subject to license terms posted there. FRBNY disclaims any responsibility or legal liability for this analysis and interpretation of Survey of Consumer Expectations data.
Reproducing this analysis
Code is available at mattsclancy/vibecession-policy-uncertainty.
Related: Does the Journalism Recession Make Economic News More Negative? examines the news environment from the supply side, where this post’s policy uncertainty index — itself a count of newspaper articles — enters from the demand side.
Related: Have our expectations outpaced economic growth? asks the same underlying question with different data: why measured wellbeing has diverged from measured economic conditions.
Related: Income, Happiness, and Trust in Government Since 2016 finds a top/bottom income divergence in institutional trust over the same period, on a different measure of how Americans assess their circumstances.
Related: US happiness has fallen to record lows documents the broader wellbeing decline that the sentiment gap here sits alongside.