US happiness has fallen to record lows
American happiness is near all-time lows. This isn’t a new observation, but it is one worth documenting carefully, because the evidence is stronger than any single survey or question wording can convey.
Across a few surveys, ways of asking, and current and future assessments of wellbeing, the picture is consistent: Americans report lower life satisfaction today than they did in the early 2000s, and well below long-run trends that are documented in the General Social Survey. COVID made it dramatically worse. Various measures of optimism about the future show similar trends.
This post documents those trends using data from the General Social Survey (GSS), the World Happiness Report (WHR), and Gallup’s wellbeing index.
The data
The General Social Survey has asked Americans the same question since 1972: “Taken all together, how would you say things are these days — would you say that you are very happy, pretty happy, or not too happy?” This is the longest consistent happiness time series available for the United States. The GSS also asks a goodlife question: whether respondents agree that their standard of living will improve.
The World Happiness Report uses the Cantril ladder, asking people to rate their current life on a 0–10 scale.
Gallup’s wellbeing index asks Americans to rate both their current life and their anticipated life in five years on a 0–10 scale, and reports the share rating each one as high.
Happiness is down across both scales
The first chart plots the GSS happiness score alongside the US life evaluation from the World Happiness Report. To make the two comparable, I score the GSS responses numerically (very happy = 9, pretty happy = 6, not too happy = 3) and take the weighted average, putting the series on the same 0–10 scale as the Cantril ladder.
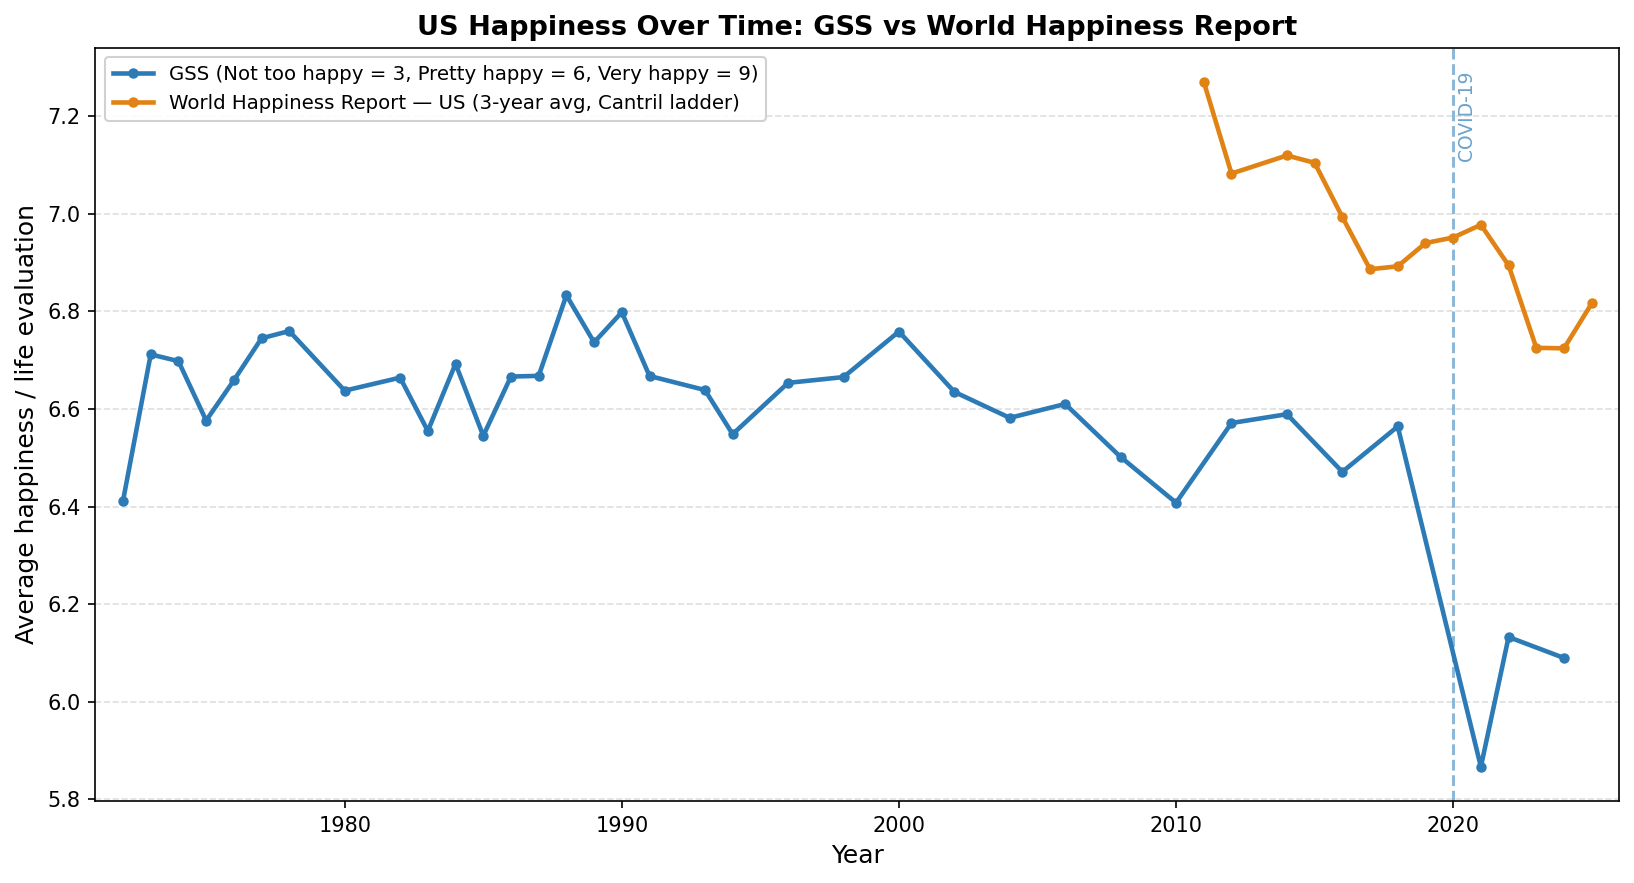
GSS weighted happiness score and World Happiness Report US life evaluation, 1972–2025.
The long-run GSS trend was broadly stable around 6.7 from the 1970s through early 2000s, fell to around 6.5 until 2020, and then crashed to the low 6s, where it has remained. The World Happiness Report series, which only extends back to 2011, exhibits a similar pattern over a shorter window: a slide from around 7.1 in the early 2010s to a new record low of 6.7 in 2024.
The share reporting high wellbeing
Another way to look at this is to ask what share of people report being genuinely happy, rather than tracking the average score. The chart below compares two such measures: the share calling themselves “very happy” in the GSS, and the share rating their current life 7 or above on Gallup’s 0–10 scale.
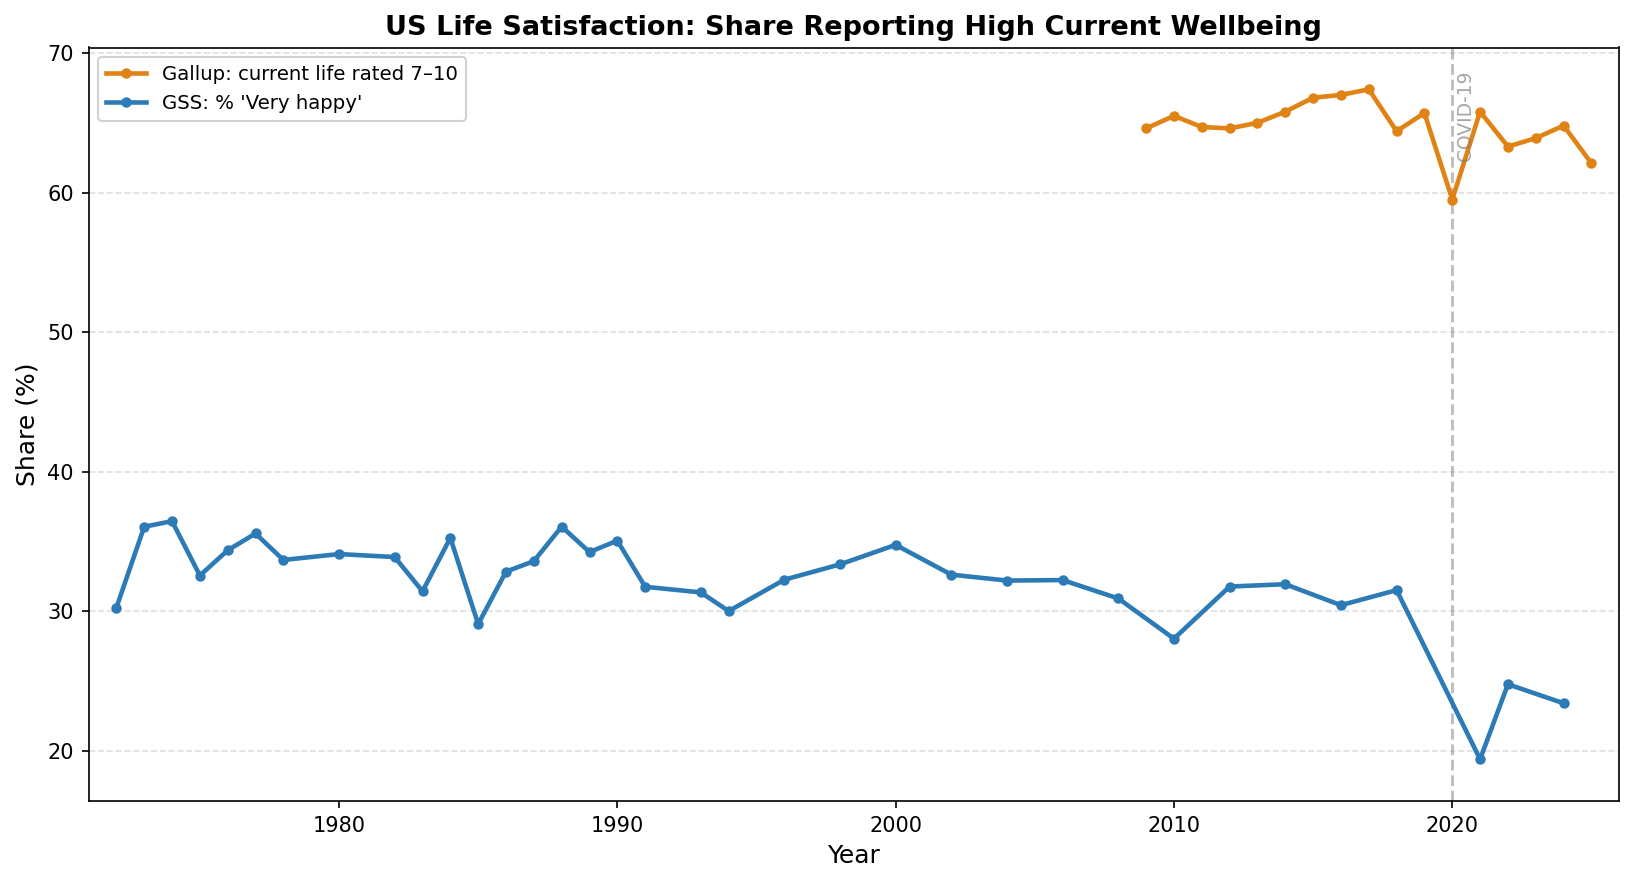
Share of Americans reporting high current wellbeing: GSS “Very happy” and Gallup current life rated 7–10. Shared y-axis; the gap reflects the different thresholds each question sets.
The gap between the two series is structural — rating your life 7 out of 10 is probably a lower bar than calling yourself “very happy,” which is why the Gallup series runs about 30 percentage points higher. Both figures show sharp declines in 2020, but the Gallup data shows a stronger recovery (though the share rating their life 7+ remains lower than the pre-2020 levels). Prior to 2020, both trends are relatively stable; the decline in average happiness we saw in the previous chart does not seem to be mainly driven by a deterioration in the wellbeing of the most well off, prior to 2020, but after 2020 they are also exhibit the general trend.
Americans don’t expect to feel better soon
There has also been a substantial change in how Americans perceive their future outlooks.
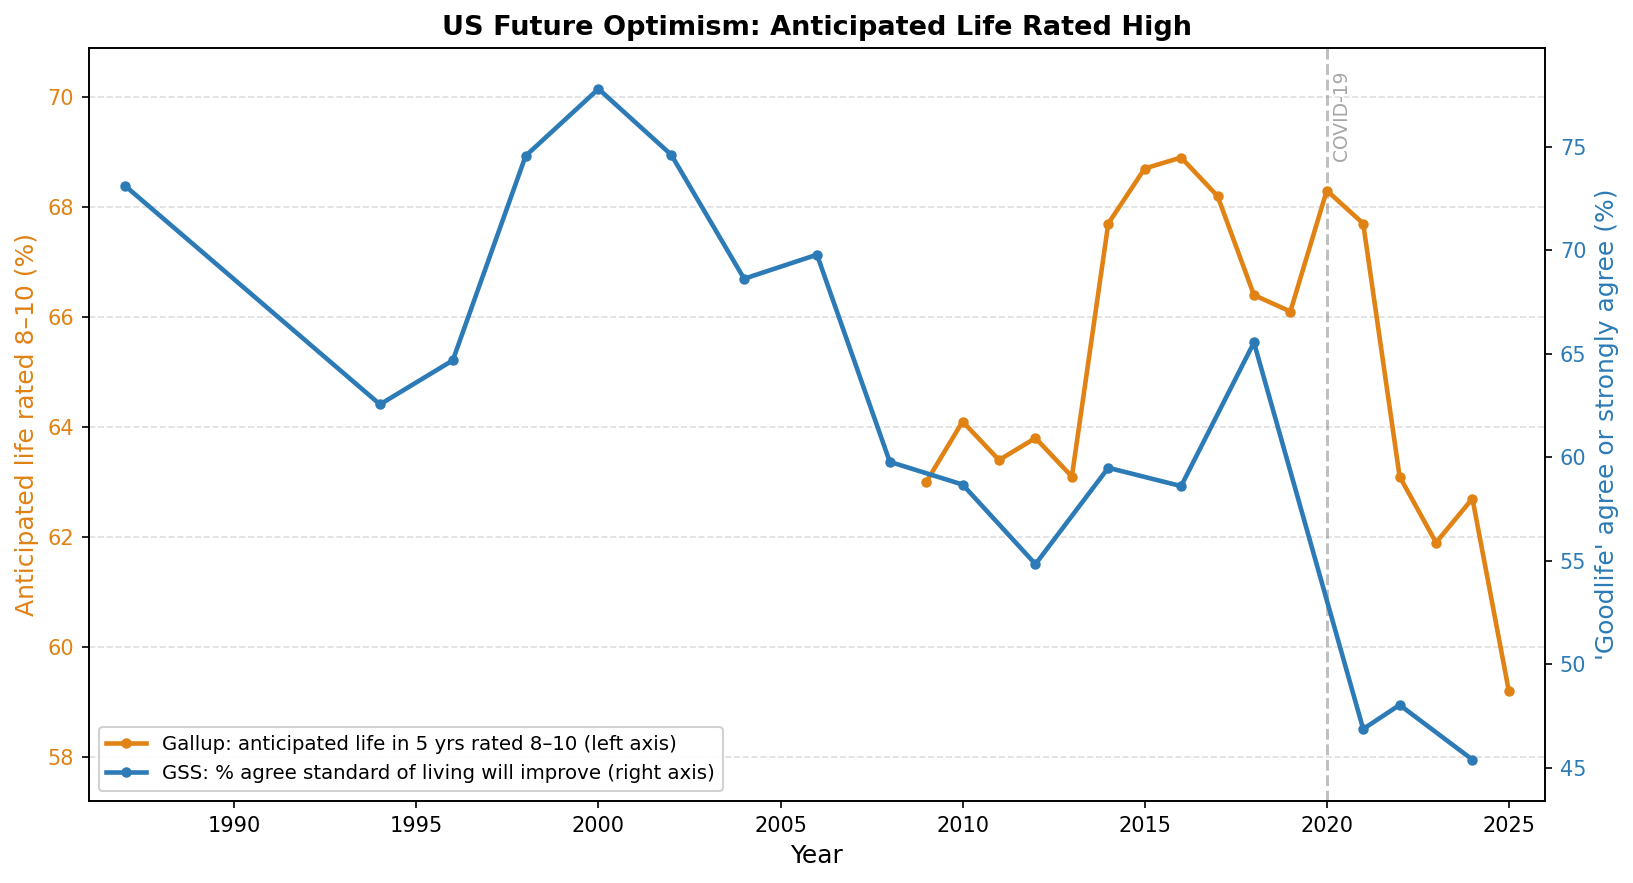
Share of Americans optimistic about the future: GSS “goodlife” agree or strongly agree, and Gallup anticipated life in 5 years rated 8–10. Dual y-axis.
Note these trends do not track exactly the same thing. The GSS goodlife question asks “The way things are in America, people like me and my family have a good chance of improving our standard of living – do you agree or disagree?” This is a relative question about whether one will improve their situation. Gallup asks if people expect to rate their life an 8-10 in the next five years. So someone who thought their life would improve from a 6 to a 7 would agree with the GSS GoodLife question and disagree with the Gallup question, while someone who thought their life would stay steady at 9 would disagree with the GSS GoodLife question and agree with the Gallup question.
The GSS GoodLife question has been asked intermittently since 1987. It has bounced around since then but fallen substantially since the early 2000s. Gallup’s series covers a shorter window and documents a large drop in optimism about the future after 2020.
Reproducing this analysis
The full code is in the us-happiness-wellbeing-trends repository.
Data
| File | Source |
|---|---|
| GSS happiness cross-tab | GSS Data Explorer: variable happy × year, wtssps-weighted, exported as XLS |
| GSS goodlife cross-tab | GSS Data Explorer: variable goodlife × year, wtssps-weighted, exported as XLS |
| World Happiness Report | WHR 2026, Figure 2.1 data download |
| Gallup wellbeing index | Gallup/Wellbeing Index, 2009–2025 |
Dependencies
pip install pandas openpyxl lxml matplotlib
Python 3.9+.
Generating the charts
python3 us_happiness_trends.py         # GSS score vs WHR life evaluation
python3 us_very_happy_vs_gallup.py     # % very happy vs % current life 7-10
python3 us_goodlife_vs_gallup_future.py  # % goodlife vs % future life 8-10
Run all scripts from the project root. Output is saved to output/.
Related: Have our expectations outpaced economic growth? uses fifty years of GSS data to test whether rising income expectations — rather than falling incomes — explain the happiness decline, finding that the income level at which Americans feel financially satisfied has grown faster than median income.
Related: Feeling Below Average at the Median shows that the share of median-income Americans rating their family income as below average has roughly doubled since the 1970s.
Related: The US Happiness Decline in International Context puts the US within-country income–happiness relationship alongside 147 other countries, and tests whether the decline reflects mean reversion to a long-run cross-sectional trend.
Related: Who Is Unhappy in America? breaks the aggregate happiness decline down by age group (18–34, 35–54, 55+), showing that the post-2010 divergence has hit young Americans hardest.
Data: General Social Survey, NORC at the University of Chicago, 1972–2024 (wtssps weights applied throughout); World Happiness Report 2026, Figure 2.1; Gallup/Wellbeing Index, 2009–2025.