The US Happiness Decline in International Context
The United States is one of 60 countries (out of 148) whose life satisfaction fell as income grew between 2010 and 2024, placing its within-country slope at the 18th percentile of the international distribution. The US is not an outlier in the cross-sectional sense — at its income level, its reported wellbeing is close to what the global trend predicts. And while its negative within-country slope is unusual, a test for mean reversion suggests the overall pattern across countries is one of persistence rather than reversion: countries above the cross-sectional happiness–income trend in 2010–15 tended to remain above it in 2016–24. The United States, which was elevated relative to trend in the first half, followed this pattern broadly — it remained above the trend in the second half, having drifted partway toward it.
This post draws on the same five-period panel described in Income and Happiness Across 156 Countries: Cantril ladder scores from the World Happiness Report at years 2012, 2015, 2018, 2021, and 2024, matched to geometric-mean GDP per capita over the corresponding three-year windows.
The US in international context
The chart below shows within-country OLS trendlines for 148 countries, colored by slope direction. The United States is shown in gold.
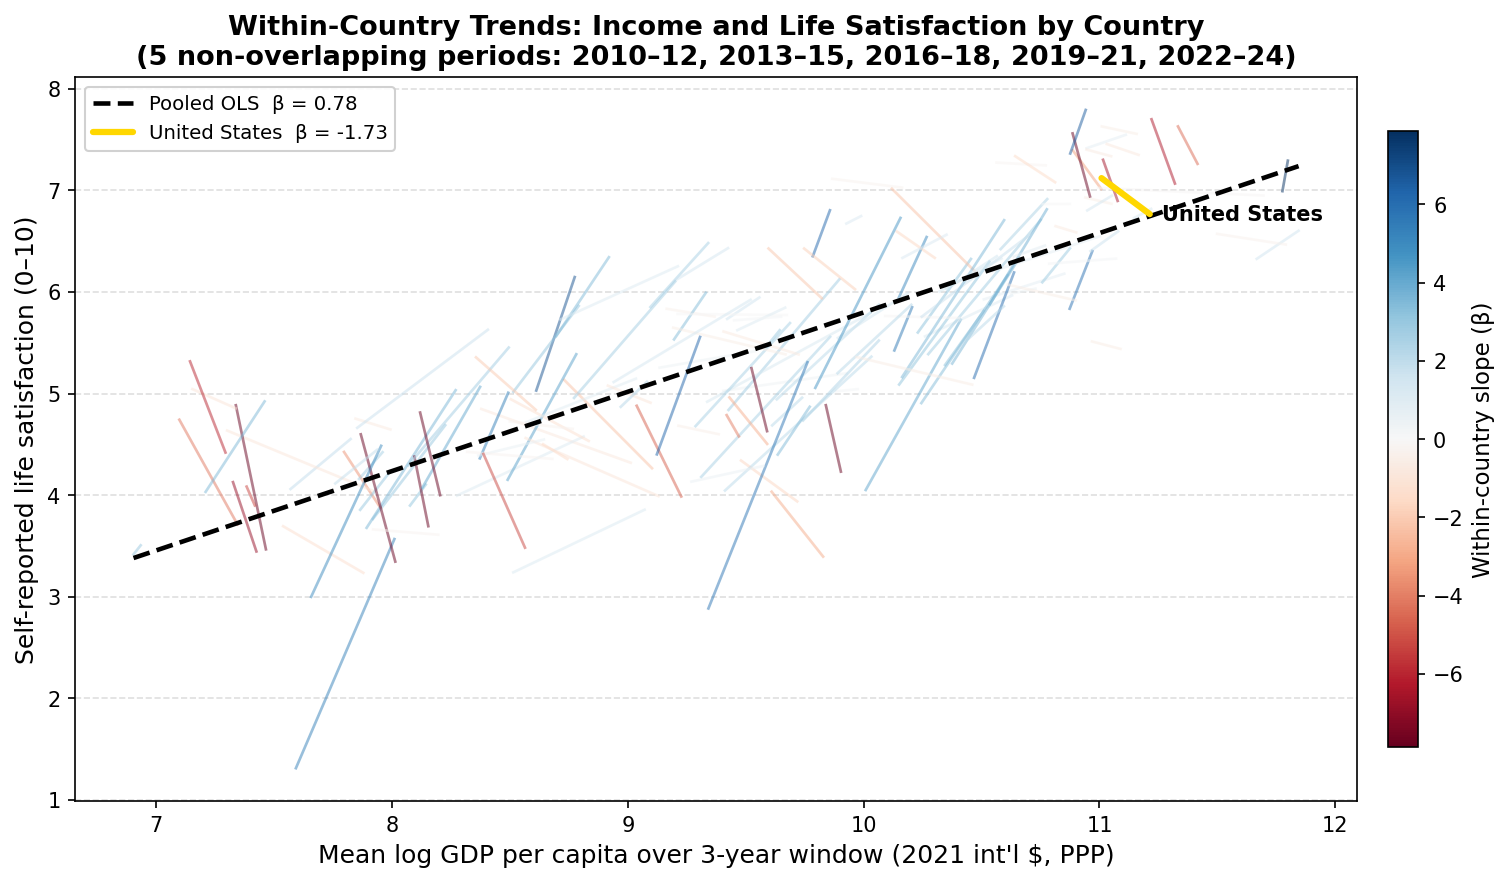
Each line is a country-specific OLS fit across the five periods. Red lines slope downward; blue lines slope upward. The dashed black line is the pooled cross-sectional OLS (β = 0.78). The United States is shown in gold.
The US line sits in the upper-right of the chart — among the world’s highest-income countries — and slopes downward at β = −1.73, implying that a doubling of GDP per capita is associated with a 1.2-point decline in life satisfaction within the US over this period. The cross-sectional slope across all countries (the dashed pooled OLS line) is β = 0.78: a doubling of GDP per capita across countries is associated with roughly 0.54 points more life satisfaction. The US tracks close to this cross-sectional line: its average Cantril score of roughly 6.9 across the five periods is near what a country at its income level is predicted to report. The decline is in the within-country time series, not in the US’s standing relative to peers.
Distribution of within-country slopes
The chart below shows the full distribution of within-country slopes across the 148 countries.
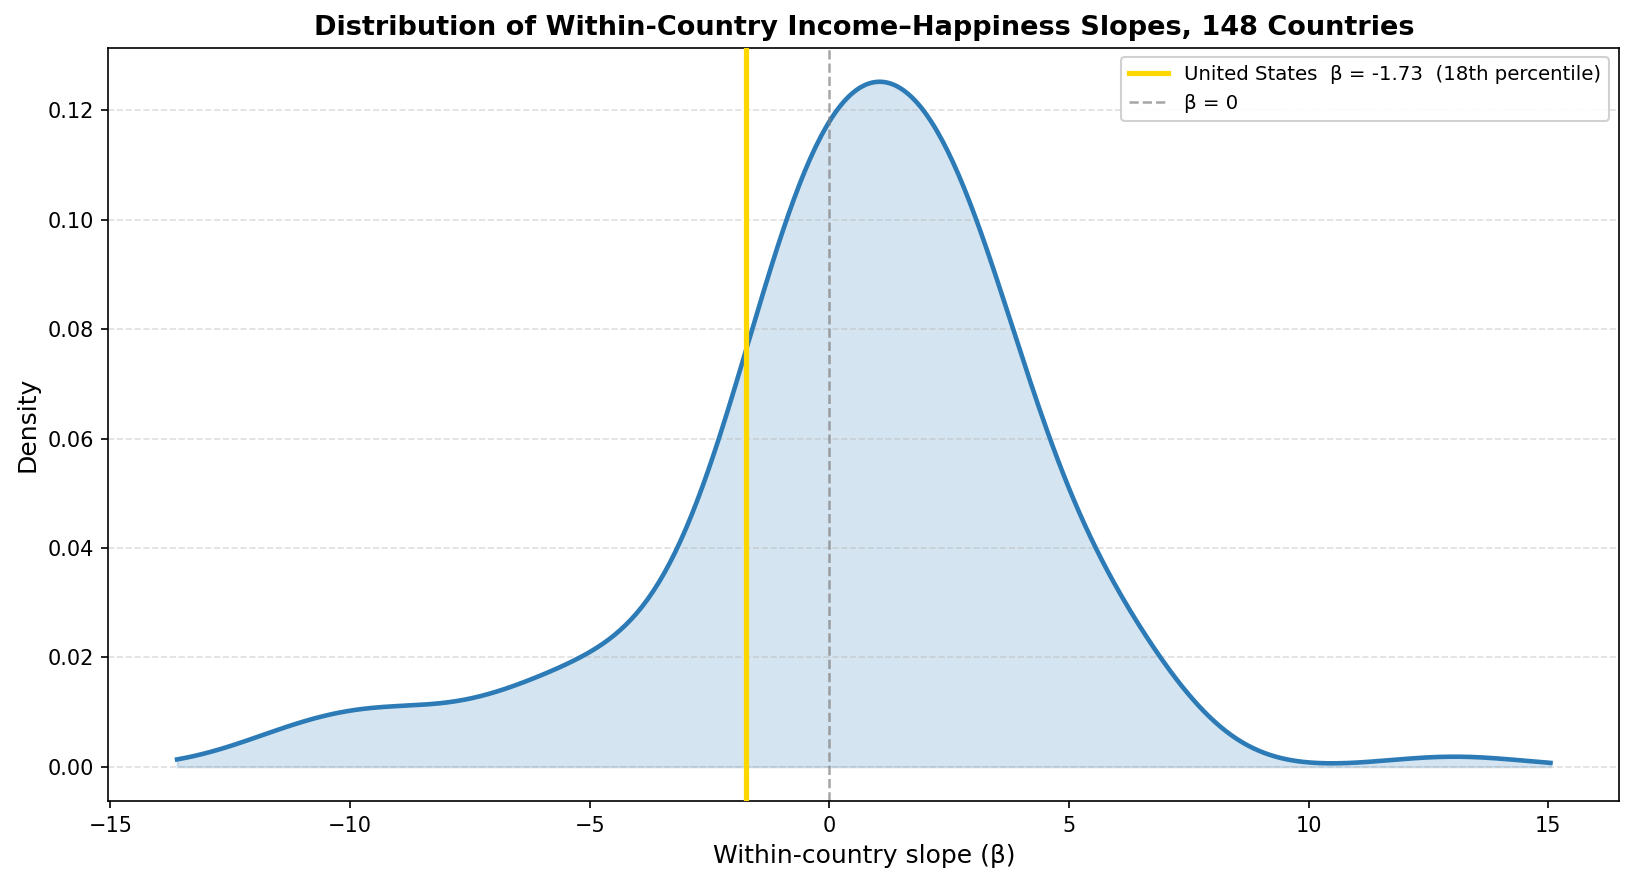
Kernel density estimate of within-country slopes. The gold line marks the United States (β = −1.73, 18th percentile). The dashed gray line marks β = 0.
The distribution is centered well to the right of zero — the median within-country slope is 0.99, equivalent to a 0.69-point increase in life satisfaction for every doubling of GDP per capita — and 88 of 148 countries (59%) have positive slopes. The US falls in the left tail, but the distribution has substantial mass below zero. Roughly 40 countries have slopes more negative than the US.
Persistence, not mean reversion
One natural hypothesis is that the US began the period unusually happy for its income level, and the subsequent decline is simply regression toward the cross-sectional mean. To test this, the panel is split into a first half (periods ending in 2012 and 2015, covering 2010–15) and a second half (periods ending in 2018, 2021, and 2024, covering 2016–24). For each country, the first-half average happiness and log GDP are used to fit a cross-sectional OLS. Each country’s residual from that line — its gap above or below the 2010–15 trend — is then included as an explanatory variable in a regression of second-half happiness on second-half log GDP.
If the coefficient on the first-half residual is negative, countries that were above trend tended to fall back toward it — mean reversion. If it is positive, deviations from the trend tend to persist.
The estimated coefficient is +0.69 (SE = 0.06). Countries above the cross-sectional trend in 2010–15 tended to remain above it in 2016–24. The chart below plots this relationship directly: the x-axis is each country’s first-half gap from the trend; the y-axis is its second-half happiness after partialing out log GDP.
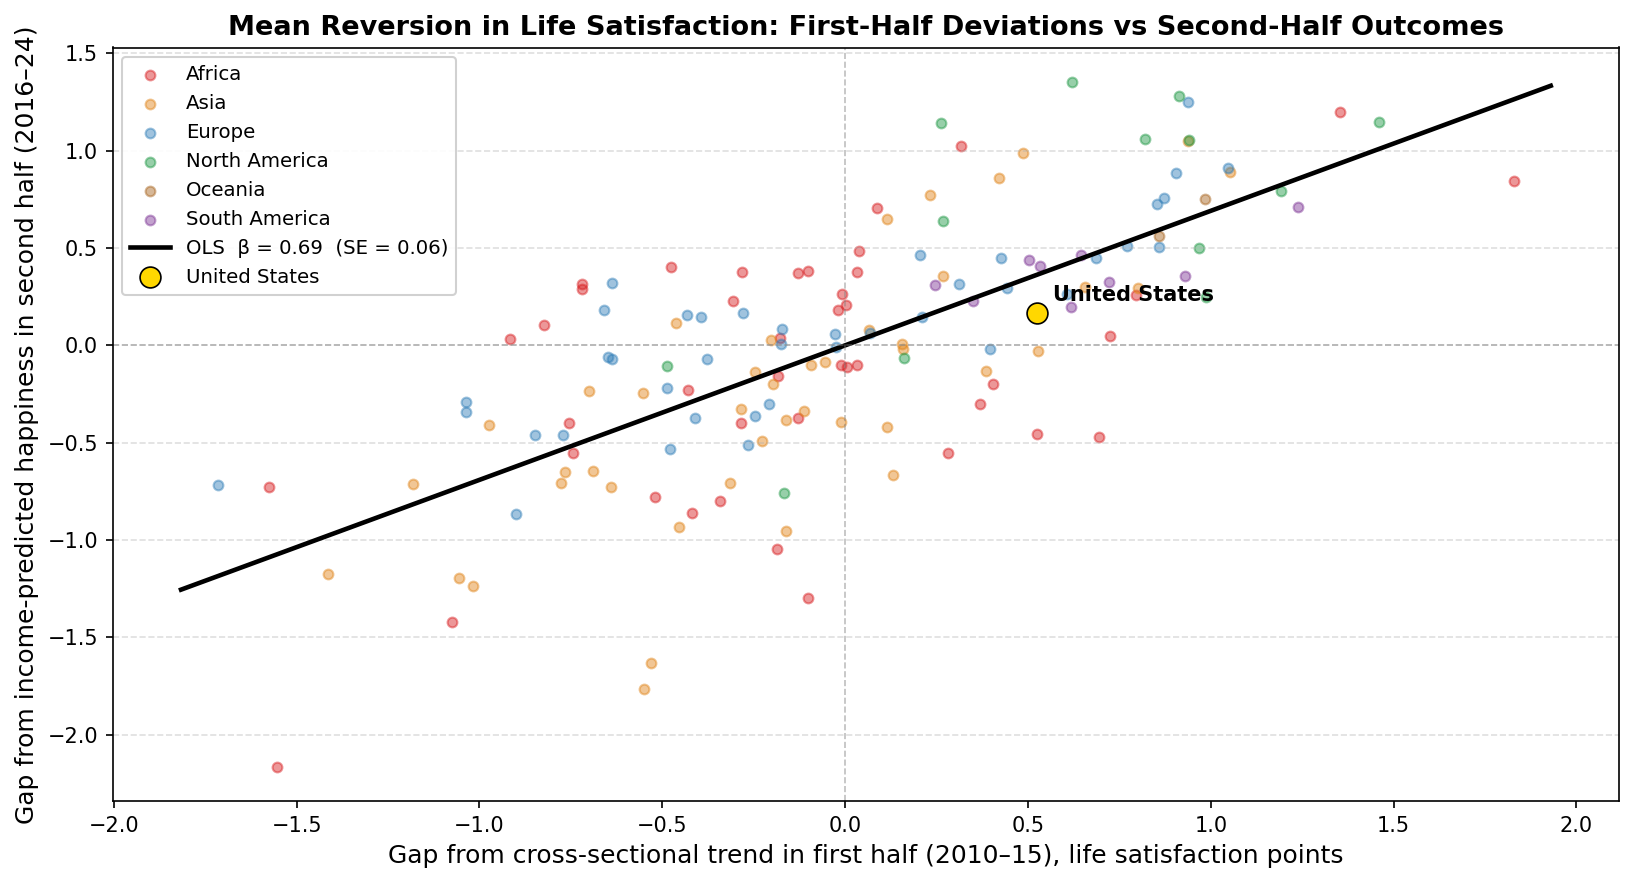
Each point is a country. The x-axis shows the gap from the 2010–15 cross-sectional trend (positive = above trend). The y-axis shows second-half life satisfaction after removing the contribution of log GDP. The black line is the OLS fit (β = 0.69, SE = 0.06). The United States is shown in gold.
The United States was 0.52 points above the cross-sectional trend in the first half — at the 75th percentile of first-half residuals. In the second half it remained 0.17 points above the income-predicted level. The persistence model predicts a second-half residual of about 0.36; the US came in at 0.17, modestly below the OLS line but still positive. The US is not a dramatic outlier in this scatter: it was elevated early, partially drifted toward the trend, and remained above it.
We (Claude Code and I) also tested whether the level of income explains cross-country variation in within-country slopes — whether richer countries tend to have more positive slopes. There is a weak positive correlation (R² = 0.025) that does not clear conventional significance thresholds. Income level does not meaningfully predict whether a country’s happiness grew or fell alongside its GDP over this period.
Reproducing this analysis
The full code is in the us-happiness-easterlin repository.
Data
This analysis uses the same datasets as the international evidence post, sourced from the World Happiness Report (Gallup World Poll Cantril ladder) and the World Bank via Our World in Data.
Dependencies
pip install pandas numpy matplotlib scipy statsmodels
Python 3.9+.
Generating the charts
python3 us_analysis.py
Output is saved to output/.
Related: Income and Happiness Across 156 Countries presents the full international evidence — cross-sectional scatter, within-country trendlines, and two-way fixed effects — from which the US analysis here draws.
Related: US happiness has fallen to record lows documents the US happiness decline in detail using GSS, World Happiness Report, and Gallup data spanning 1972–2025.
Related: Who Is Unhappy in America? breaks the US happiness decline down by age group, showing that young Americans (18–34) have experienced the sharpest fall and now report happiness well below both older cohorts and their own historical levels.
Related: A Lifetime Wellbeing Index: Happiness Weighted by Life Expectancy extends the same panel to a composite index (Cantril × life expectancy), placing the US at the 13th percentile of the within-country lifetime wellbeing slope distribution — slightly further left than its 18th-percentile position on the Cantril slope alone.