Who Is Unhappy in America?
While Americans of all ages have become less happy since the 2010s (and especially since 2020), young Americans — those 35 and under — have long reported lower happiness than their elders and the gap has widened since 2010. At the same time, young people’s perception of their relative financial position has deteriorated over the entire post-war period, reversing a pattern from the 1970s in which they were the most financially optimistic age group. Financial satisfaction, by contrast, has moved more in tandem across age groups, tracking the business cycle rather than any age-specific trend.
Who these groups are
Three age brackets — 18–34, 35–54, and 55+ — divide the weighted GSS sample into roughly equal thirds as of the early survey years, but the composition has shifted considerably. In 1972, 39% of adult respondents fell in the 18–34 bracket, 33% in 35–54, and 29% in 55+. By 2024 those shares had roughly inverted for the two outer groups: 29% are 18–34, 33% are 35–54, and 39% are 55+. Any trend that looks stable in aggregate is increasingly dominated by the experience of older Americans.
Happiness
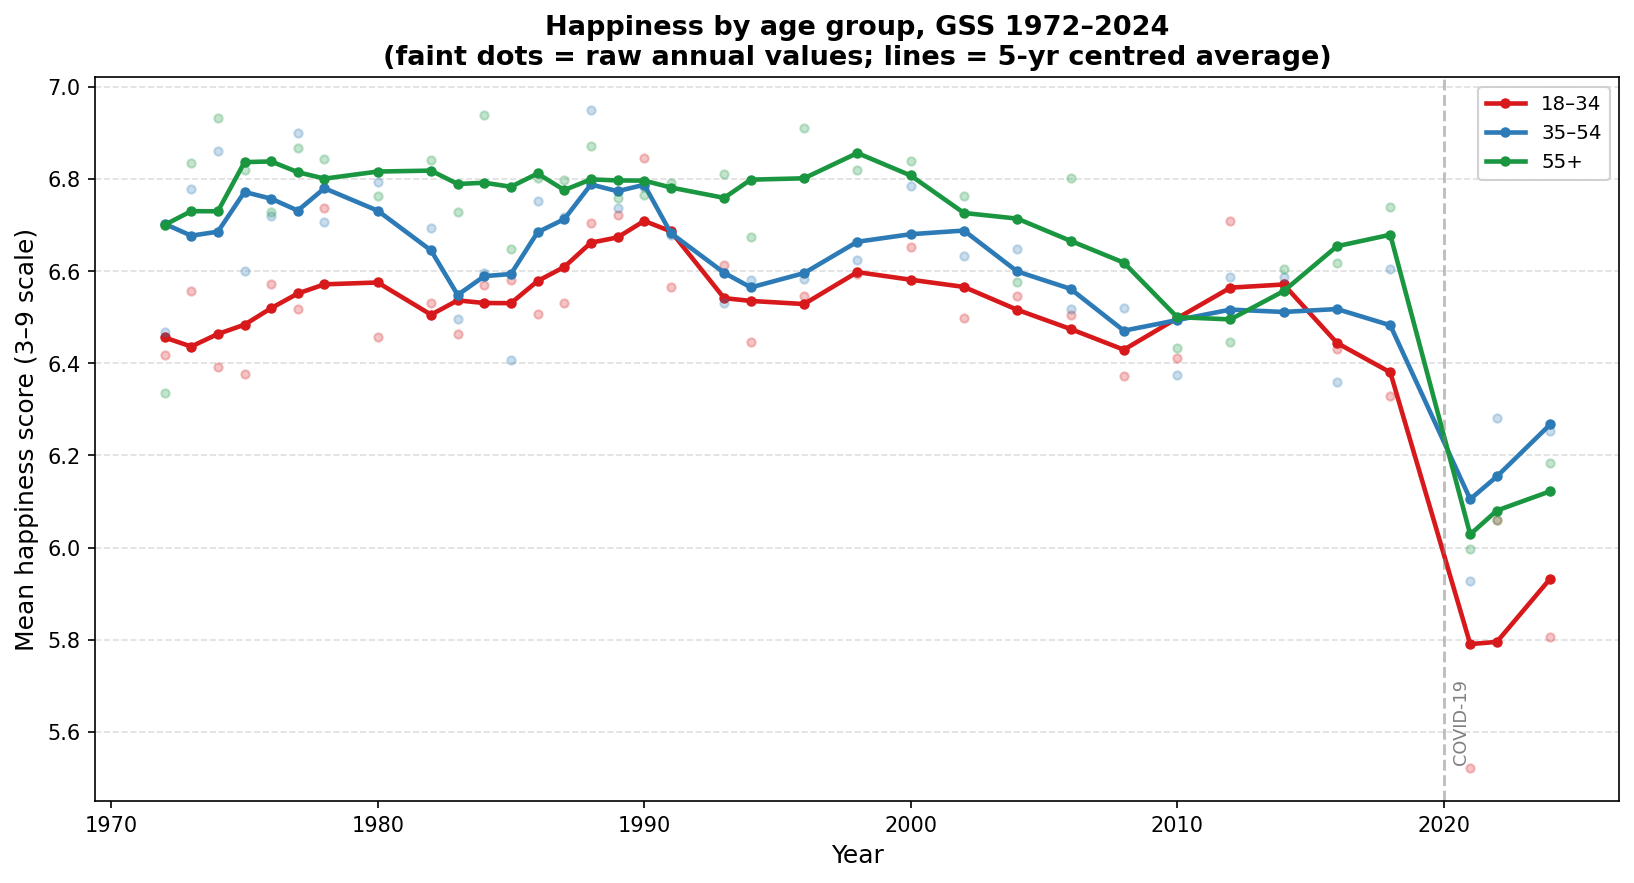
From the early 1970s through the mid-2000s, the three age groups reported broadly similar happiness levels, with the 18–34 group running a modest 0.1–0.2 points below the other two on a 3–9 scale. In 1972 the gap between young adults and the average of the other two groups was effectively zero.
Beginning around 2012, the lines begin to separate. The decline that accelerated sharply in 2021 — visible in all three groups — hit 18–34 year olds hardest: their mean score fell from 6.33 in 2018 to around 5.5 in 2021, roughly twice the decline seen in older groups. By 2024, with some recovery, 18–34 year olds score 5.80, compared to 6.25 for the 35–54 group and 6.18 for those 55+.
Within the two older groups, 55+ had been the happier cohort from roughly 2000 through 2019. In 2024 the 35–54 group sits slightly above 55+, a reversal from recent years. Whether this reflects a genuine shift or is a feature of the post-pandemic recovery is not yet clear from two data points.
Perceived financial position
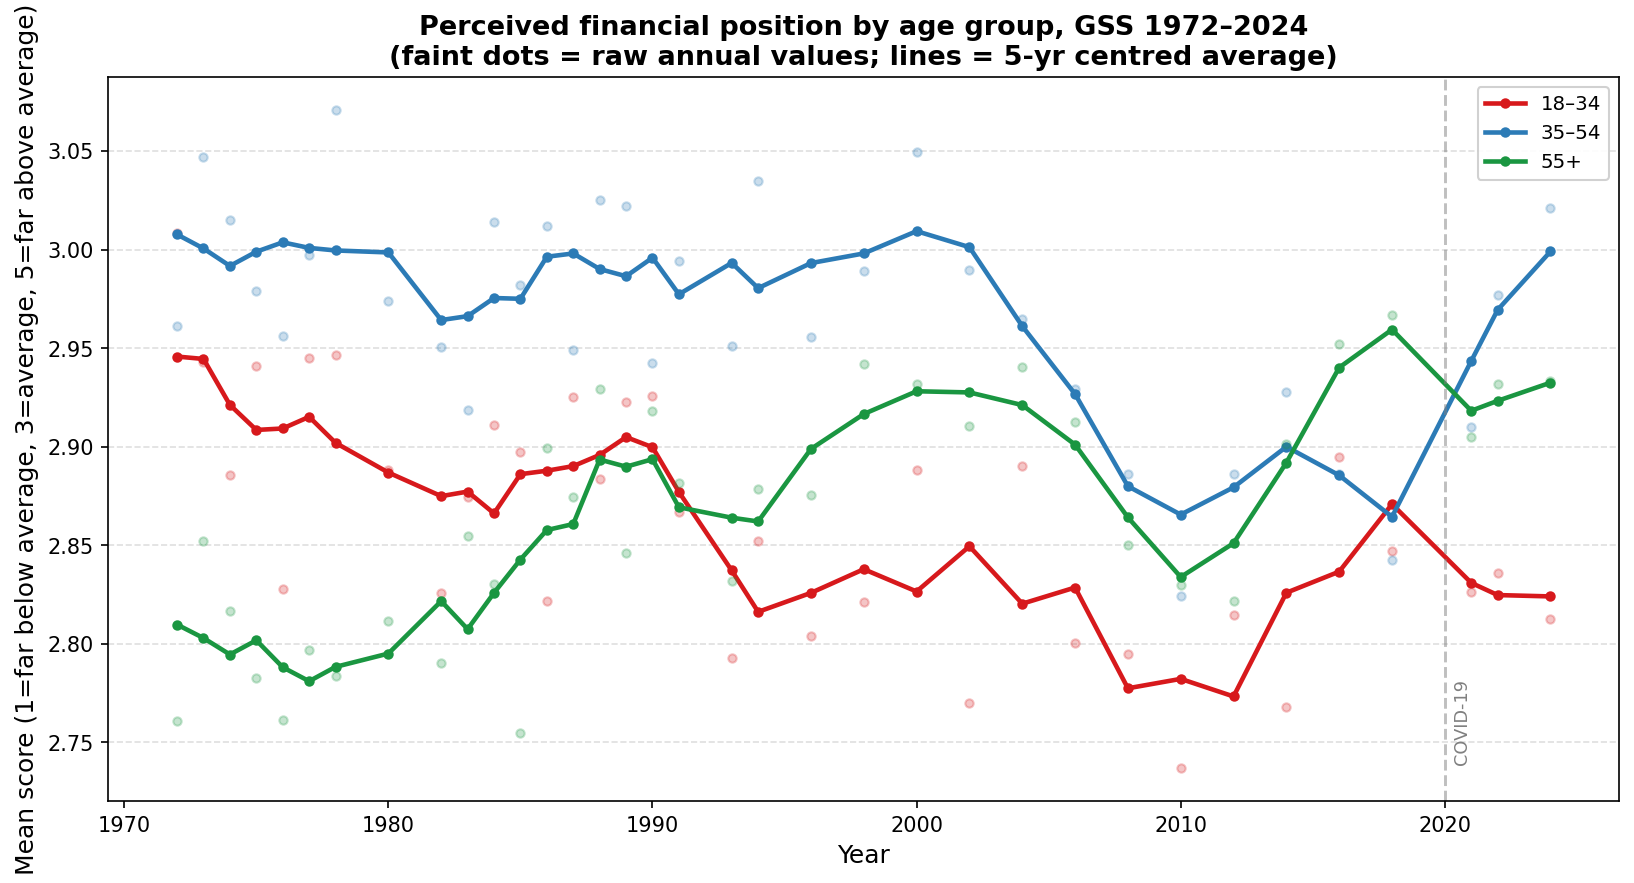
The GSS asks respondents whether their family income is far below average, below average, average, above average, or far above average relative to other Americans. Scored 1–5 (with 3 representing “average”), the responses reveal a striking reversal across age groups over the past half-century.
In 1972, 18–34 year olds rated their financial position at 3.01 — essentially average, and slightly above both the 35–54 group (2.96) and well above the 55+ group (2.76). Older Americans were the most likely to feel economically left behind. By the 2010s that ranking had fully reversed. The 55+ group has risen gradually to around 2.93, the 35–54 group recovered from a sharp dip around the 2008–2010 financial crisis back to roughly 3.0, and the 18–34 group has drifted down to 2.81 — now the lowest of the three.
The shift for 35–54 year olds is the most episodic: a sharp drop during the global financial crisis followed by a recovery to pre-crisis levels. The trends for the other two groups are slower-moving and directional across the entire period, with 18–34 year olds becoming steadily more pessimistic about their relative standing and 55+ year olds becoming steadily less so.
Financial satisfaction
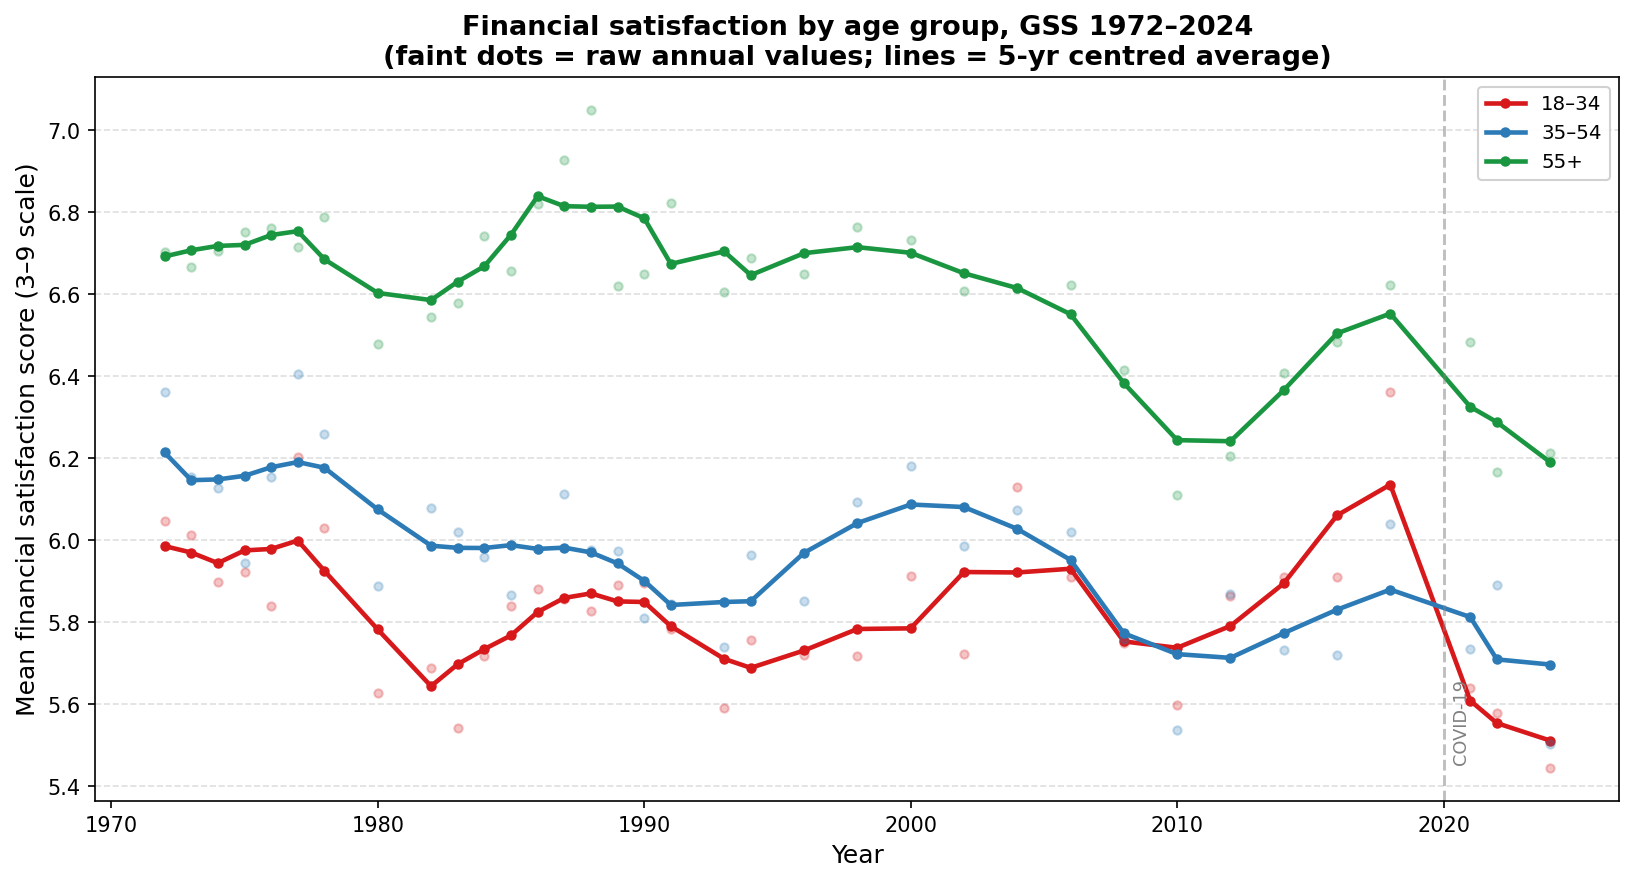
Satisfaction with one’s financial situation (scored 3–9, from “not satisfied at all” to “pretty well satisfied”) tells a different story. Here the 55+ group has been the most satisfied throughout the entire series, the 35–54 group intermediate, and 18–34 the least satisfied — a ranking that has been stable since the 1970s, with no notable change in the gaps between groups.
What moves financial satisfaction is primarily the business cycle. All three groups dipped in the early 1980s recession and again around 2010, and all three registered a sharp drop in 2021 before partial recovery. Unlike the finrela series, there is no clear secular divergence between age groups; the lines shift roughly in parallel. The 2024 readings — 5.44 for 18–34, 5.50 for 35–54, and 6.21 for 55+ — are near the low end of the historical range for all three groups.
The contrast with the finrela chart is worth noting directly. The two questions measure related but distinct things: finrela asks how you compare to others, while satfin asks how satisfied you are in absolute terms. A young person who sees themselves as below average relative to peers (finrela) may still report moderate satisfaction if their absolute standard of living is adequate, and vice versa. The divergence between the two series suggests that young adults’ growing sense of relative disadvantage has outpaced any change in their absolute financial experience.
Data
All estimates use the General Social Survey (GSS), weighted with wtssps (post-stratification weights). Happiness is scored 3/6/9 (not too happy / pretty happy / very happy). Financial satisfaction (satfin) uses the same scale. Perceived financial position (finrela) is scored 1–5 across five response categories. All charts show annual weighted means as faint dots with 5-year centered averages as the main lines.
Reproducing this analysis
Data were downloaded from GSS Explorer. Code is available at mattsclancy/gss-happiness-by-age.
Related: US happiness has fallen to record lows documents the aggregate decline in American wellbeing across the GSS, the World Happiness Report, and Gallup, providing the broader context for the age-group breakdowns here.
Related: Have our expectations outpaced economic growth? uses the same finrela and satfin variables to estimate the income level at which Americans begin to feel financially dissatisfied, and finds a similar post-2008 deterioration.
Related: Feeling Below Average at the Median tracks the share of median-income Americans who rate their family income as below average, broken down by income band rather than age.