Income and Happiness Across 156 Countries
Countries with higher GDP per capita report substantially higher life satisfaction: a doubling of income per head is associated with roughly half a point more on the 0–10 Cantril ladder. That cross-sectional relationship holds within countries over time as well. A two-way fixed effects regression controlling for permanent country differences and global period-to-period shifts yields a coefficient of 1.34 (clustered SE = 0.36) — larger, not smaller, than the pooled cross-sectional estimate of 0.78 (SE = 0.02).
The analysis uses 733 country-period observations from 156 countries across five non-overlapping periods spanning 2010–2024.
Data
Life satisfaction scores are from the World Happiness Report, based on the Gallup World Poll’s Cantril ladder question (0–10). Each annual observation in the underlying dataset is itself a 3-year rolling average, so consecutive rows share two years of underlying survey data. To avoid that overlap, the analysis uses five non-overlapping periods: the Cantril score at years 2012, 2015, 2018, 2021, and 2024, each representing the survey average of the preceding three calendar years. GDP per capita is from the World Bank via Our World in Data, measured in 2021 international dollars at PPP; for each period the three annual GDP values are log-transformed and averaged, giving the geometric mean GDP per capita over the window. (2013 is absent from the dataset; the World Happiness Report did not publish a 2013 edition.)
Cross-country relationship
The chart below pools all 733 country-period observations. Each point is one country in one period; the black line is pooled OLS.
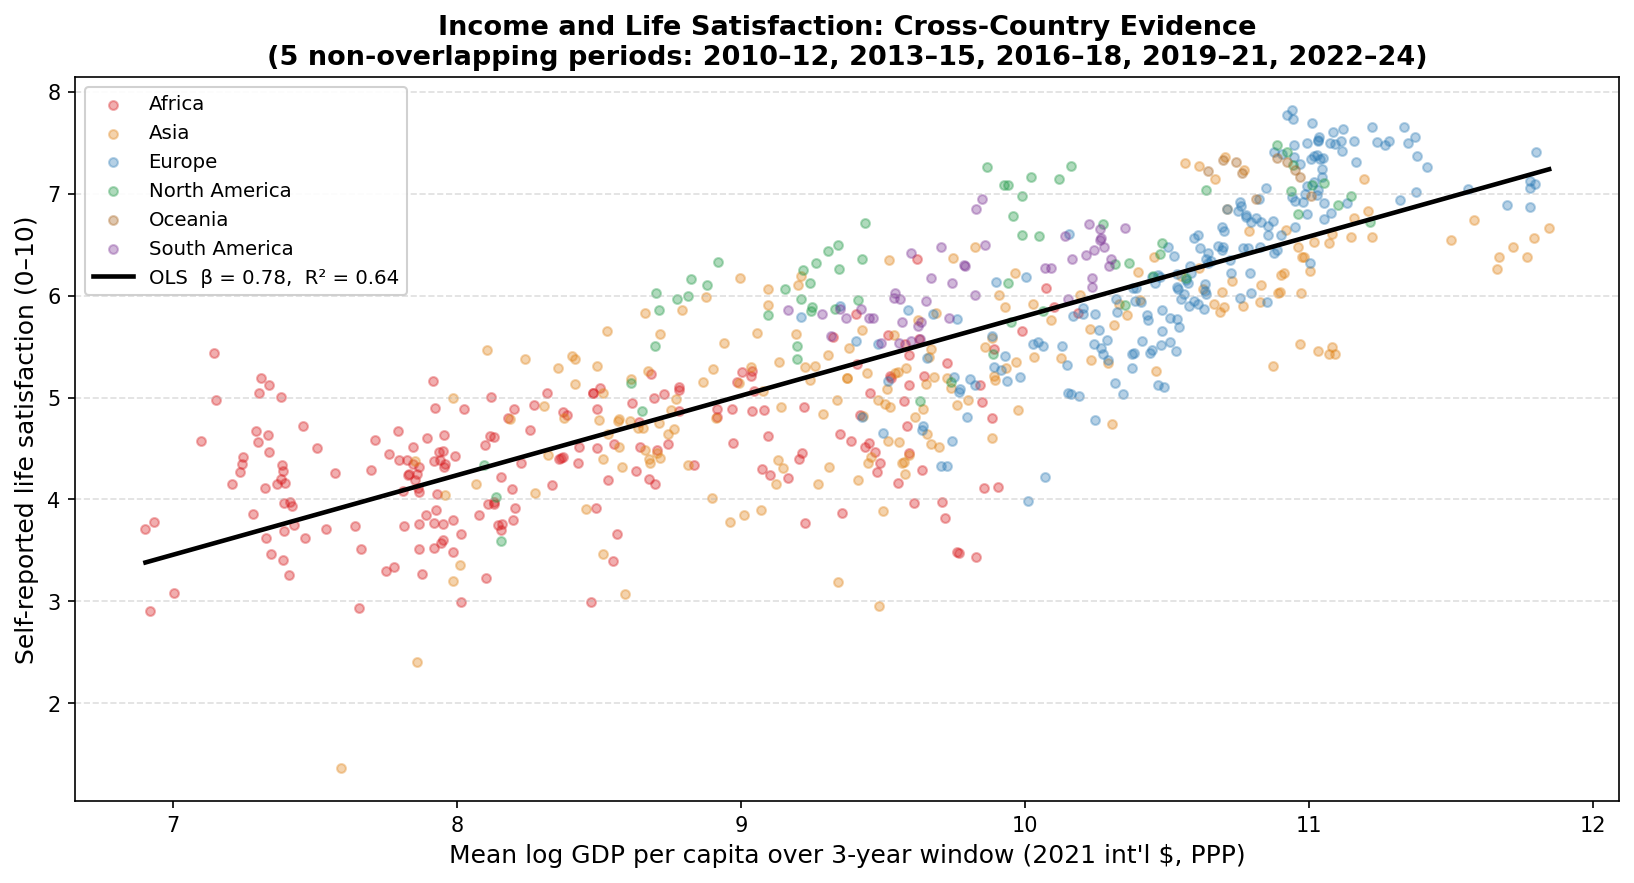
Each point is a country-period. Colors denote world region. OLS fit is pooled across all observations.
The slope of 0.78 (SE = 0.02) implies that a doubling of GDP per capita is associated with roughly 0.54 points more life satisfaction. The R² of 0.64 means log income accounts for about two-thirds of the cross-country variance in wellbeing. The relationship is consistent across regions: the fitted line passes through roughly 4.0 at log GDP of 7 (around $1,100 per capita) and 7.1 at log GDP of 11 (around $60,000 per capita). African countries, which cluster in the lower-left, and European countries, which cluster in the upper-right, both sit close to the line.
Within-country trendlines
The chart below replaces the single pooled line with a separate OLS fit for each of the 148 countries that have at least three period observations. Each line spans that country’s minimum-to-maximum range of mean log GDP per capita across its observed periods. Color encodes the within-country slope: red lines slope downward, blue lines slope upward.
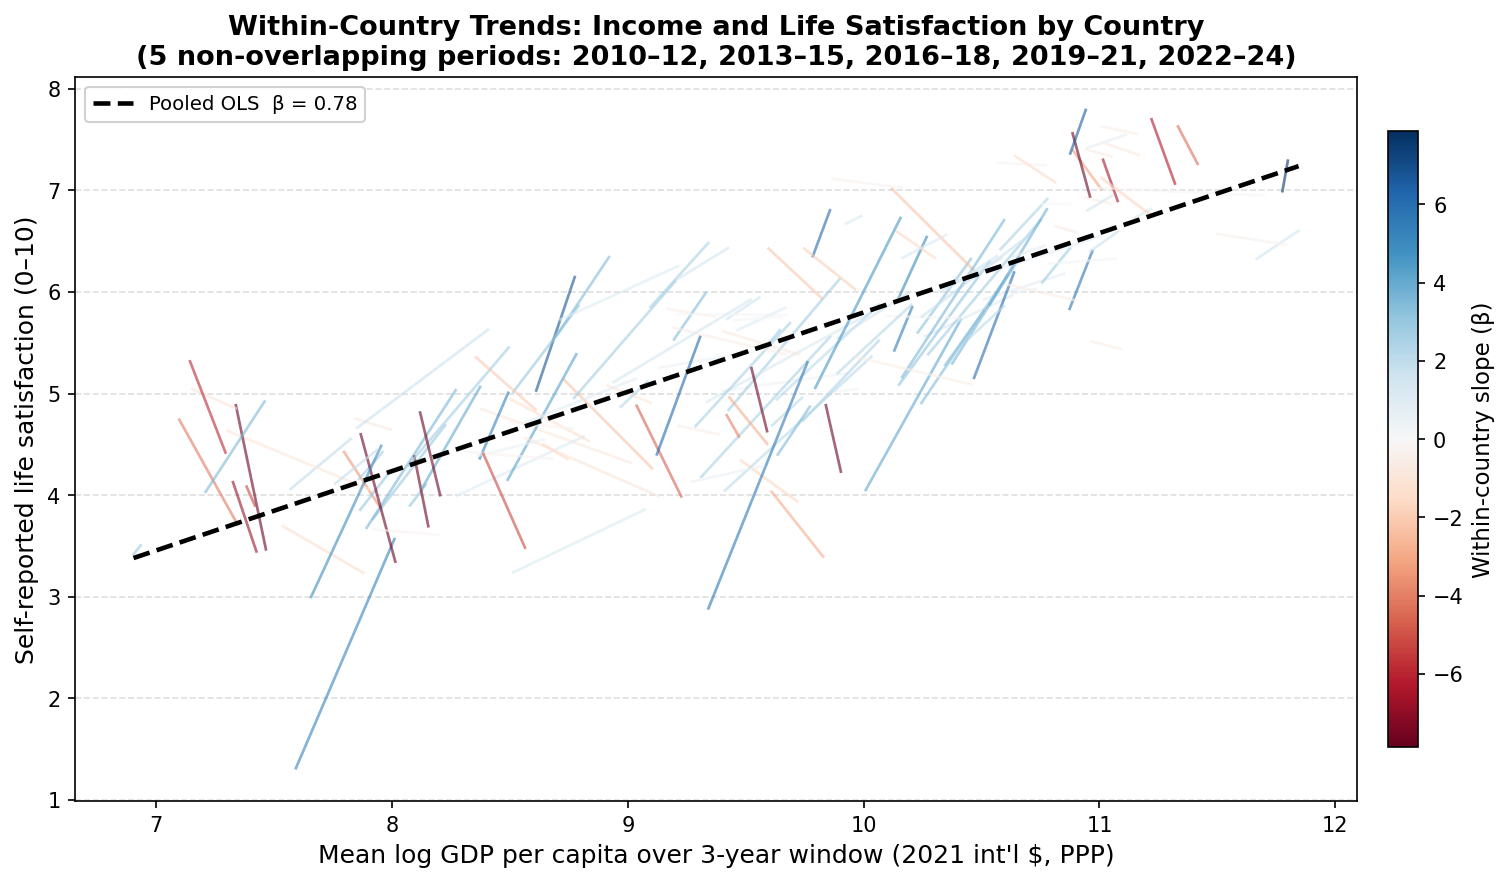
Each line is a country-specific OLS fit. The dashed black line is the pooled OLS from the chart above. Color encodes within-country slope direction and magnitude (red = negative, blue = positive).
Of the 148 countries, 88 (59%) have positive within-country slopes and 60 (41%) have negative ones. The median within-country slope is 0.99. The distribution varies by region: Europe has a median slope of 1.95 (40 countries), North America 1.42 (13 countries), South America 1.09 (9 countries), Asia 1.05 (41 countries), and Africa −0.93 (43 countries).
The dashed pooled OLS line (β = 0.78) sits below most of the blue country-specific lines, consistent with the TWFE result below: within-country slopes, where positive, tend to be steeper than the across-country average.
Two-way fixed effects
The within-country trendlines above still mix two sources of variation: genuine time-series comovement within each country, and any systematic differences in income trends across countries. The two-way fixed effects (TWFE) regression isolates only within-country, within-period variation by simultaneously removing permanent country-level differences in both income and happiness, and global period-to-period shocks that affected all countries at once (for example, the 2020 Covid-19 pandemic).
To visualize this, both mean log GDP per capita and life satisfaction are partialed out by country and period fixed effects. The residuals from those two regressions are plotted against each other below; the TWFE slope is their OLS relationship. Standard errors are clustered by country.
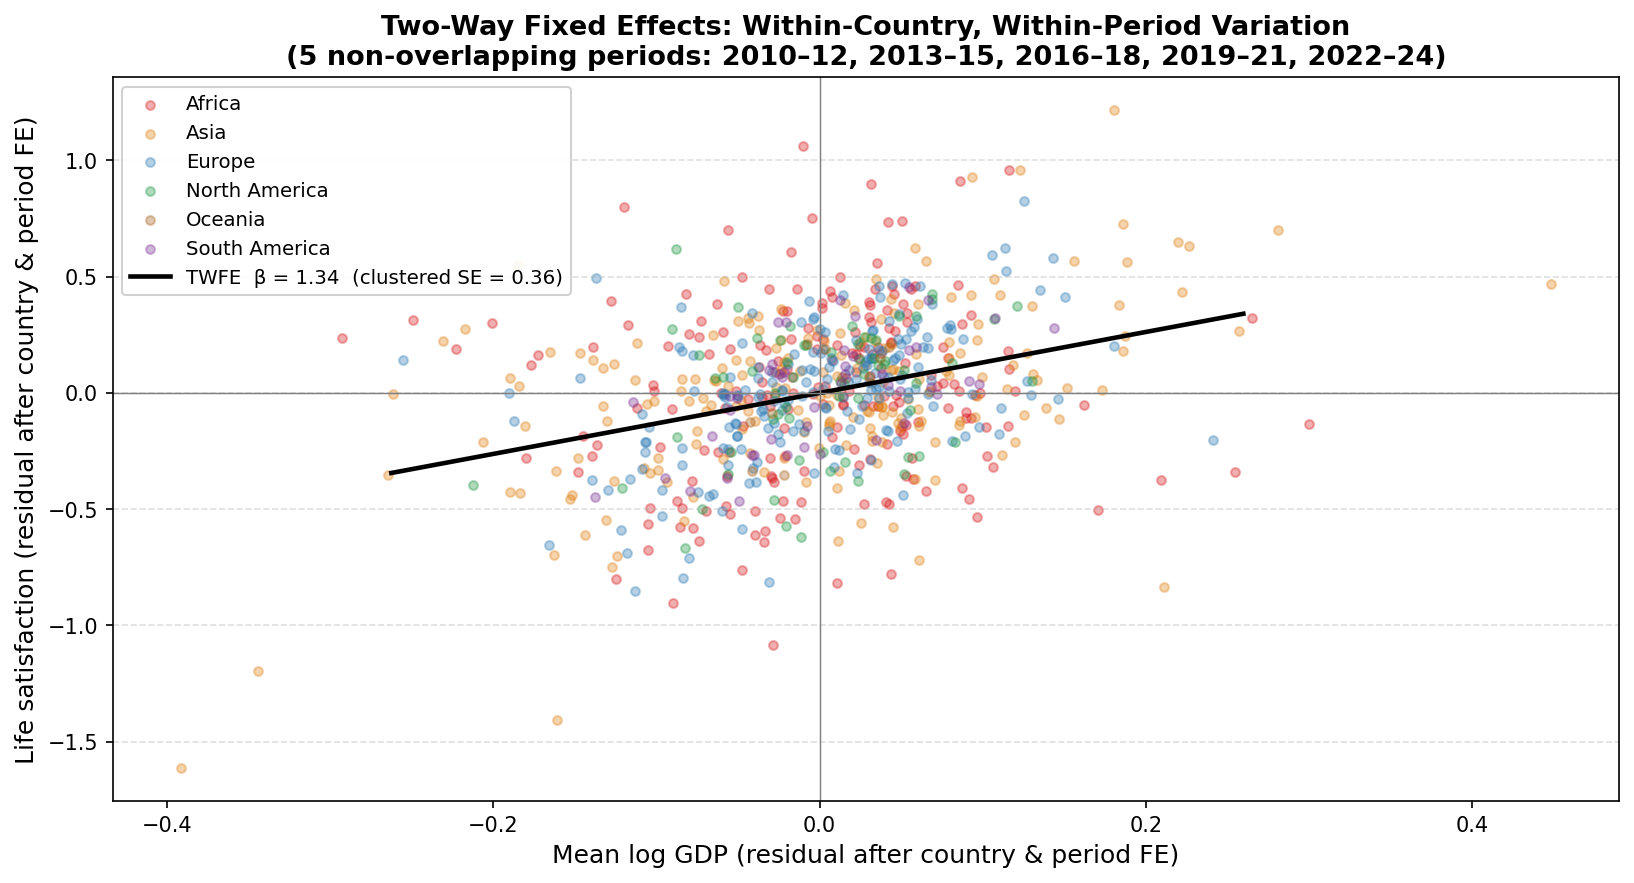
Each point is a country-period. Axes show residuals after removing country and period fixed effects from both variables. The black line is the TWFE estimate (β = 1.34, clustered SE = 0.36).
The TWFE coefficient is 1.34 (clustered SE = 0.36). Within a country, a period in which mean GDP per capita is 10% above that country’s baseline — after netting out the global period effect — is associated with roughly 0.13 points higher life satisfaction. A doubling of a country’s own GDP corresponds to a predicted gain of about 0.93 points.
The TWFE coefficient is larger than the cross-sectional estimate of 0.78. This is the opposite of the usual attenuation toward zero that fixed effects produce when confounders are positively correlated with the independent variable. One candidate explanation is short-run business cycle comovement: recessions and recoveries move income and happiness together at the country level, generating a steep within-country slope over a panel that spans both the post-2008 recovery and the COVID shock.
Reproducing this analysis
The full code and data are in the easterlin-paradox repository.
Data
| File | Source | Description |
|---|---|---|
gdp-per-capita-worldbank.csv |
World Bank via Our World in Data | GDP per capita, 2021 int’l $ PPP |
happiness-cantril-ladder.csv |
World Happiness Report / Gallup World Poll | Cantril ladder score (0–10), 3-year rolling averages |
Dependencies
pip install pandas numpy matplotlib scipy statsmodels
Python 3.9+.
Generating the charts
python3 robustness_4period/robustness_4period.py
Output is saved to robustness_4period/output/.
Related: The US Happiness Decline in International Context applies the same five-period framework to the US specifically, placing its negative within-country slope in the distribution of 148 countries and testing whether it reflects mean reversion to the long-run cross-sectional trend.
Related: Does Growth Itself Raise Happiness? extends this analysis by asking whether the *pace of GDP growth predicts life satisfaction beyond the income level it reaches, across international cross-sections and US Census divisions.*
Related: A Lifetime Wellbeing Index: Happiness Weighted by Life Expectancy extends the same five-period panel by multiplying the Cantril score by life expectancy at birth, examining how the cross-country and within-country income relationships change under the composite index.