Does Growth Itself Raise Happiness?
Income level is a powerful predictor of life satisfaction: across countries, a doubling of GDP per capita is associated with roughly half a point more on the 0–10 Cantril ladder, and the relationship holds within countries over time as well — see Income and Happiness Across 156 Countries. But does the pace of economic growth matter for happiness, above and beyond the level of income it eventually delivers? We might believe, for example, that faster growth is associated with optimism about the future, and this leads to happiness. Or we might believe that faster growth leads to less happiness, because it is disruptive to the comfortable status quo. This post asks whether countries or regions that grew faster also report higher life satisfaction once income level is held constant.
Method
For a given cross-section, life satisfaction is regressed on log GDP per capita to capture the level effect. The residuals from that regression — satisfaction above or below what a country’s income level predicts — are then compared against prior annualised GDP growth rates over different windows. A positive/negative slope in the residual-growth scatter would indicate that growth itself, not just the income it reaches, predicts wellbeing. A flat slope would indicate that growth only matters insofar as it raises the income level.
International evidence
Using 147 countries in 2019, log GDP per capita explains 62% of the cross-country variance in life satisfaction (β = 0.75). The chart below plots the residuals from that level regression against 15-year annualised GDP growth (2004–2019):
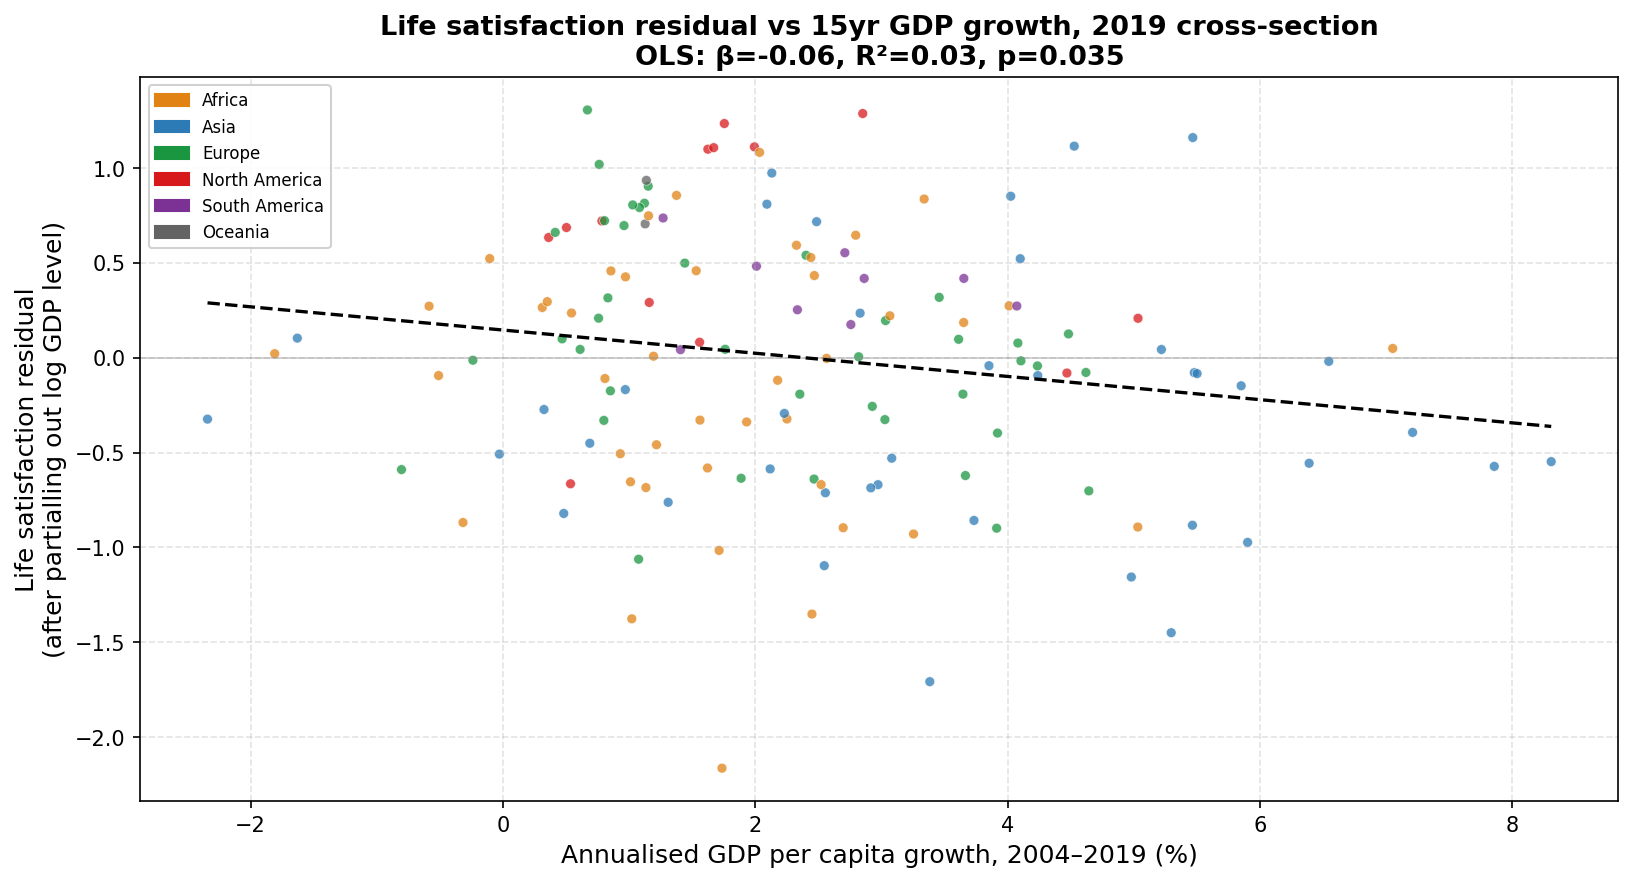
Life satisfaction residuals (after removing the contribution of log GDP per capita) vs annualised GDP per capita growth, 2004–2019. OLS: β = −0.061, R² = 0.03, p = 0.035, N = 147.
The slope is weakly negative (β = −0.061): countries whose economies expanded faster over the prior 15 years reported slightly lower life satisfaction than their income levels would predict, not higher. The R² is 0.03 — prior growth accounts for 3% of the variance in residuals. Shorter growth windows show no relationship at all: 1-year growth (2018–2019) yields β = −0.006 (p = 0.747), and 3-year growth (2016–2019) yields β = −0.009 (p = 0.716).
The chart below repeats the exercise on two pre-COVID cross-sections — 2011 and 2019 — each matched to the prior 8 years of annualised growth:
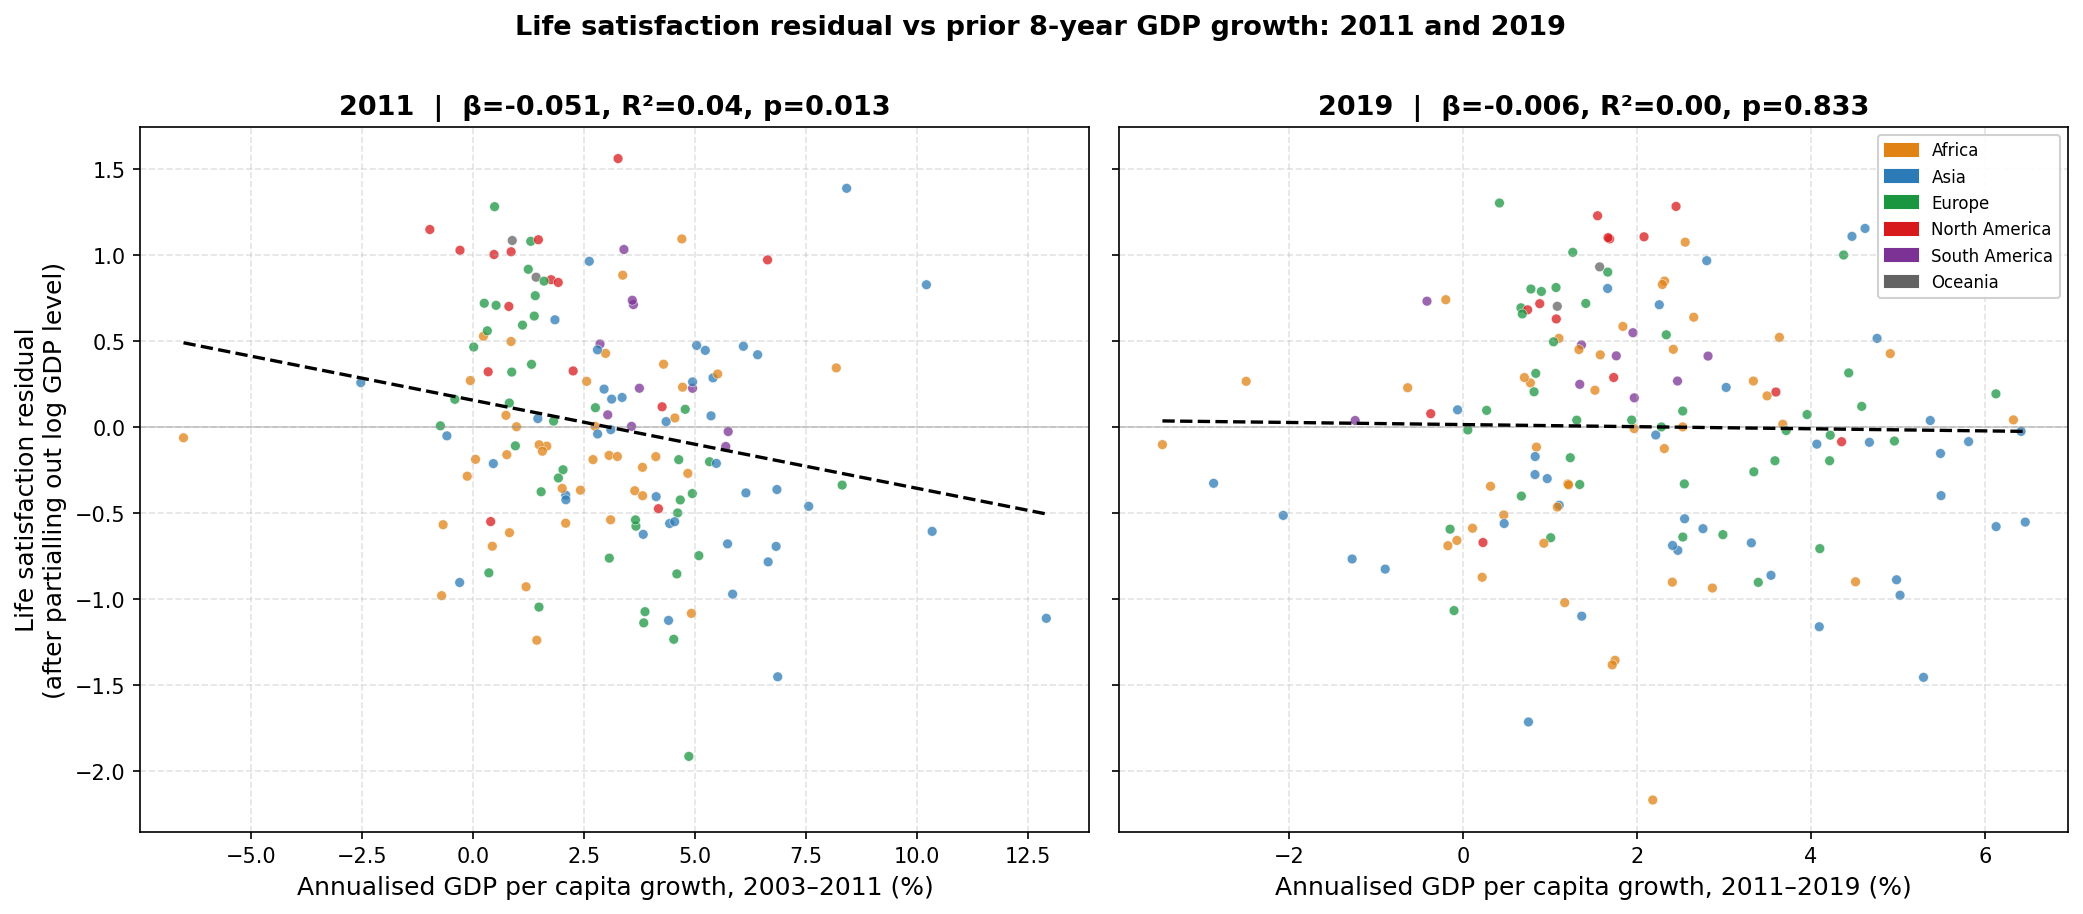
Left: 2011 cross-section, residuals vs 2003–2011 growth (β = −0.051, R² = 0.04, p = 0.013, N = 149). Right: 2019 cross-section, residuals vs 2011–2019 growth (β = −0.006, R² = 0.00, p = 0.833, N = 148).
The 2011 cross-section shows a moderately negative slope: countries that grew rapidly in the decade before 2011 tended to report somewhat lower-than-predicted satisfaction in 2011. The 2019 cross-section is effectively flat. The difference between the two panels illustrates how unstable the relationship is across time periods. Pooling both cross-sections (N = 297):
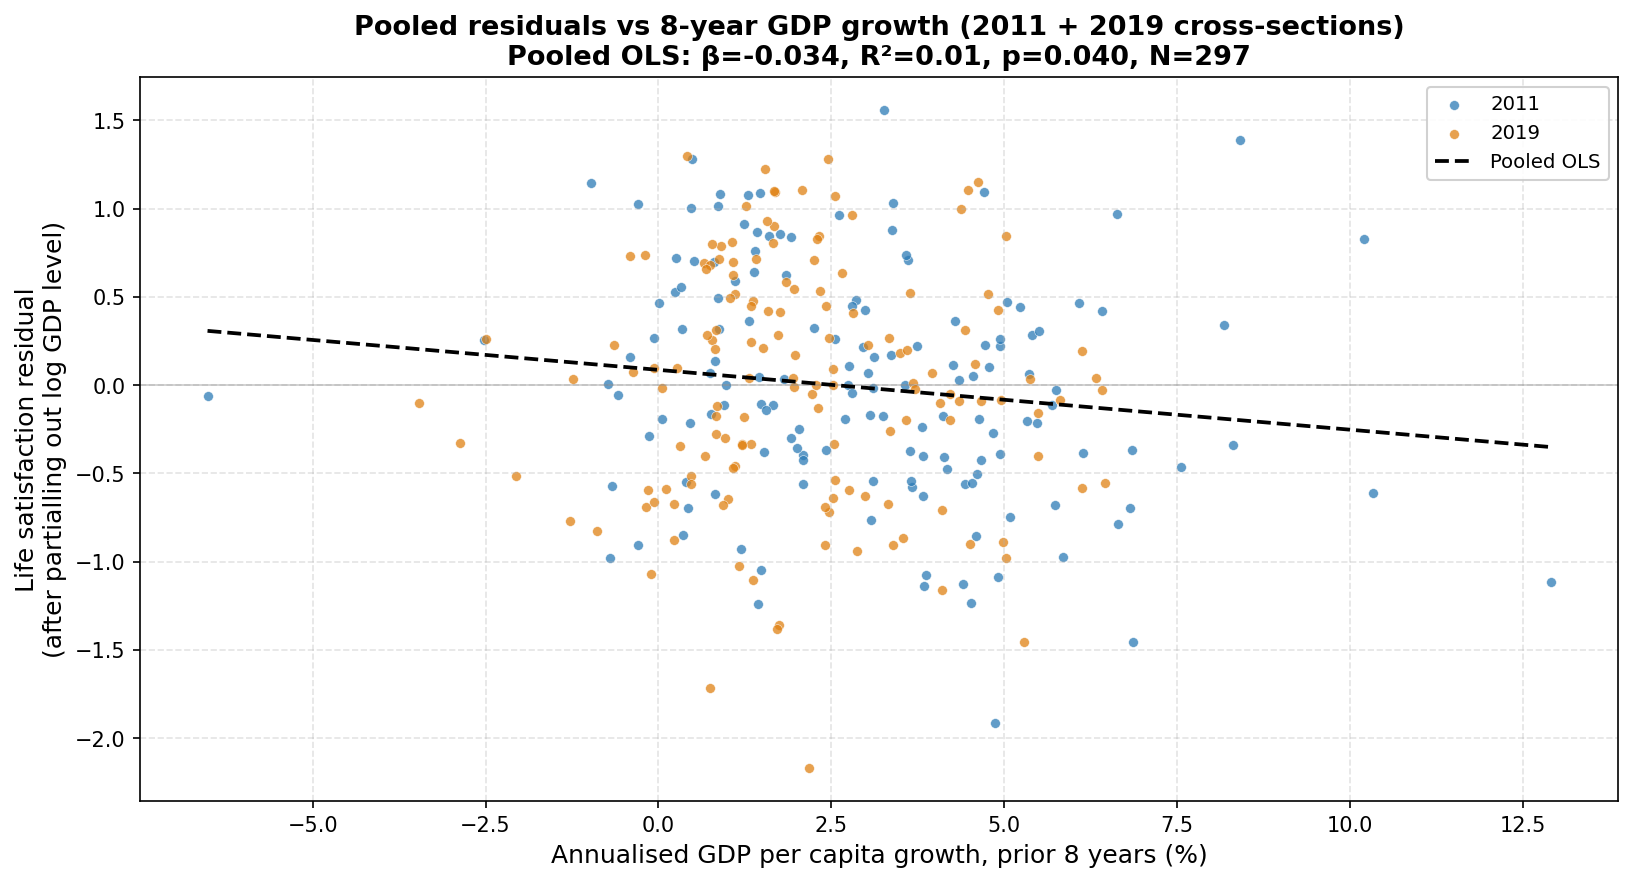
Pooled from 2011 and 2019 cross-sections (N = 297). Blue: 2011 observations; orange: 2019. Pooled OLS: β = −0.034, R² = 0.01, p = 0.040.
The pooled estimate is β = −0.034 (p = 0.040), marginally significant and driven substantially by the 2011 cross-section. Prior 8-year growth rates account for roughly 1% of the variance in life satisfaction residuals once income level is controlled for.
US regional evidence
The same approach applied to the 9 US Census divisions offers an independent check using domestic data. Here, weighted average GSS happiness (on a 3–9 scale) replaces the Cantril ladder, and real per capita personal income (from BEA state data, deflated to 2017 dollars) replaces GDP.
A caveat is necessary before reading the regional results. The level-happiness relationship across Census divisions is weak — R² near zero in every cross-section — almost certainly because income variation across regions is far narrower than across countries. In 2017, the richest Census division earned 1.5× the income of the poorest; across countries in 2019, the ratio was 126×. Put in log terms, the standard deviation of log real per capita income across the 9 divisions is 0.13, compared to 1.13 across countries — an 8-fold difference in the income variation available to the regression. Within the US, individual income is strongly associated with happiness: logistic regressions on GSS microdata show that a 10% income increase is associated with a 0.43 percentage point lower probability of being “not too happy” and a 0.55 percentage point higher probability of being “very happy.” The weak regional level relationship likely reflects insufficient variation to detect what is there at the individual level, not the absence of an income-happiness link. The growth residuals reported below inherit that limitation.
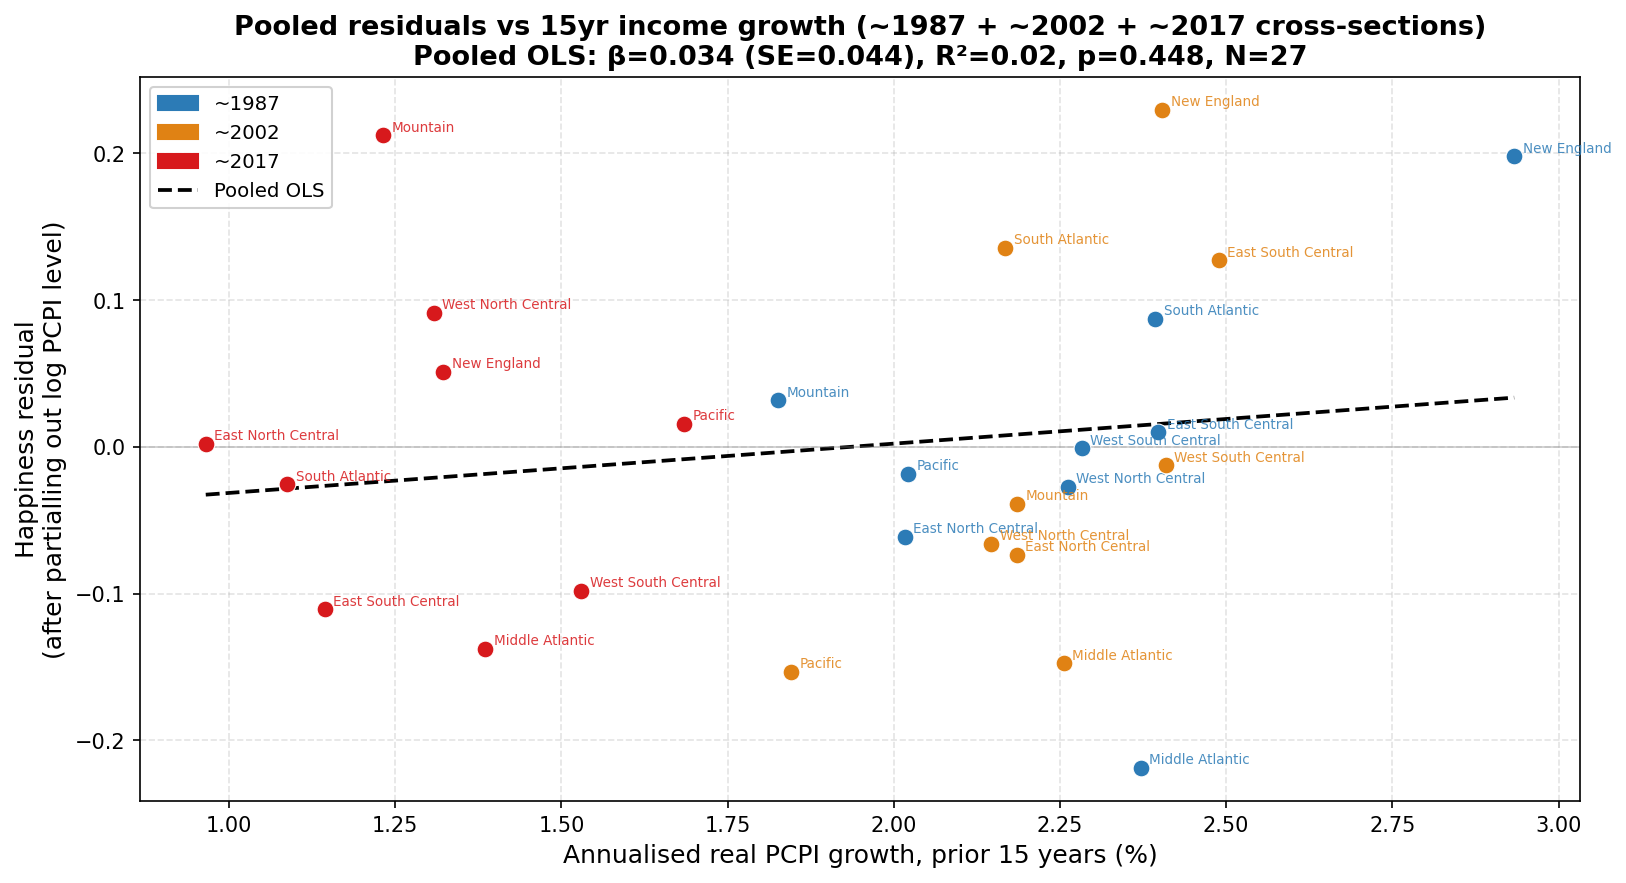
Pooled from ~1987, ~2002, and ~2017 cross-sections (N = 27, 9 regions × 3 periods). Happiness residuals (after removing the contribution of log real per capita personal income) vs prior 15-year annualised income growth. Pooled OLS: β = 0.034, SE = 0.044, p = 0.448.
Three cross-sections spaced 15 years apart — happiness averaged around 1987, 2002, and 2017 — yield 27 region-period observations. The pooled slope is β = 0.034 (p = 0.448), effectively zero. The point estimate is slightly positive — the opposite sign from the international result — but far from significant. Neither direction nor magnitude supports the hypothesis that faster-growing regions report higher happiness once income level is accounted for.
Reproducing this analysis
The full code and data are in the easterlin-growth repository.
Data
| Source | Variable |
|---|---|
| World Happiness Report / Gallup World Poll | Life satisfaction (Cantril ladder, 0–10) |
| World Bank via Our World in Data | GDP per capita (2021 int’l $, PPP) |
| General Social Survey | Happiness (3–9 scale), weighted by wtssps |
| BEA SAINC1 + FRED GDPDEF | Real per capita personal income by Census division (2017 $) |
Dependencies
pip install pandas numpy matplotlib scipy statsmodels openpyxl
Related: Income and Happiness Across 156 Countries documents the income-level relationship this analysis builds on — the cross-country scatter, within-country trendlines, and two-way fixed effects.
Related: Have our expectations outpaced economic growth? uses GSS data to examine how perceptions of financial wellbeing have shifted relative to income thresholds over 50 years.