Income, Happiness, and Trust in Government Since 2016
Drafted by Claude Code from an analysis I directed and reviewed.
Trust in government and the press shows a genuine top/bottom income crossover since the 2010s: higher-income Americans, who used to be more trusting of government and more distrustful of the press than lower-income Americans, have swapped places with them. That crossover survives several robustness checks — but a placebo test shows it isn’t specifically tied to 2016; it’s the latest, sharpest stretch of a divergence that’s been building since at least the 1980s. Happiness tells a messier story: the standard “share not too happy” measure suggests the income gap in happiness widened faster after 2016, but that doesn’t hold up once the “very happy” share is tracked too — both income groups’ happiness fell together after 2016, by statistically indistinguishable amounts.
This tests a hypothesis from a recent paper by Jaehong Park, which argues that America’s 2016 populist realignment followed a specific sequence — places in economic decline grew angrier first, then prosperous places caught up after the realignment, closing the gap from the top down. The household-level GSS analogue below doesn’t confirm that sequence cleanly on either outcome, but it doesn’t return a flat null either — it surfaces a real and interesting institutional-trust reversal that just isn’t well-explained by 2016 specifically.
The happiness gap has been growing since the 1970s
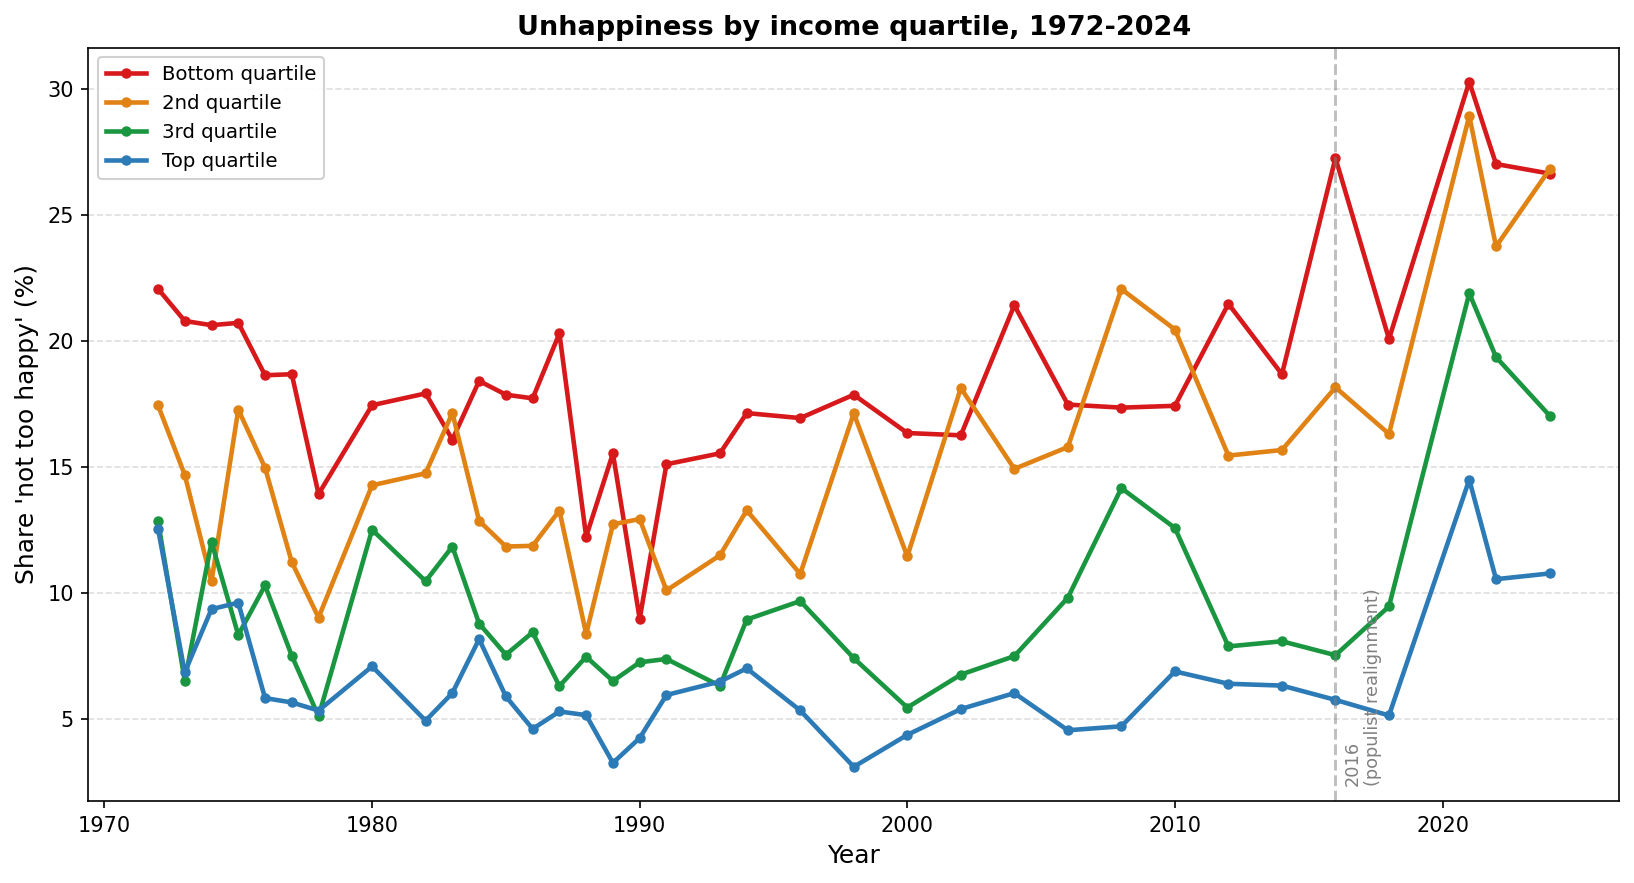
The share of GSS respondents reporting they are “not too happy,” split by weighted household-income quartile, shows a wide and long-standing gap: the bottom quartile has reported roughly two to three times the unhappiness rate of the top quartile in nearly every survey year since 1972. That gap is not new, and it is not something that appeared in 2016 — but the years around 2016-2021 show the sharpest and most sustained rise on record for the bottom quartile, from about 17% in the early 2010s to over 25% by the early 2020s.
Does the gap widen faster after 2016?
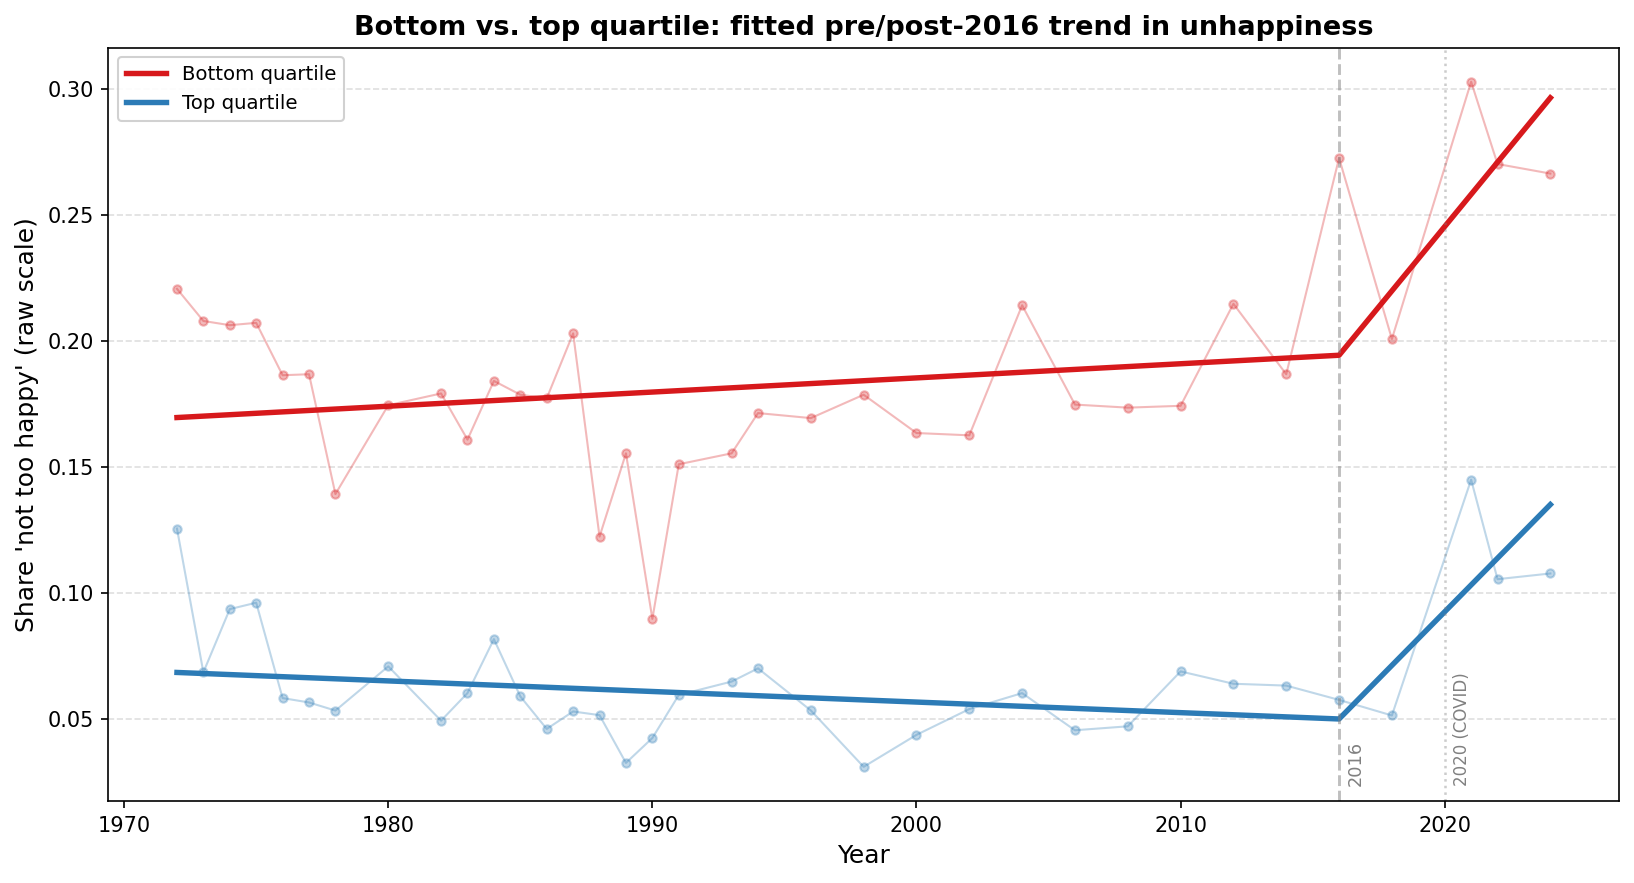
Fitting a separate linear trend to each quartile’s unhappiness rate before and after 2016, with demographic controls (age, sex, race, education, marital status, region) and clustered standard errors, both quartiles show a clear acceleration: the bottom quartile’s unhappiness rate rises by 1.52 percentage points a year faster after 2016 than before (t=5.8), and the top quartile’s by 1.09 points a year faster (t=6.0) — both highly significant, and both estimated mostly off a handful of post-2016 waves, several during COVID. Whether the bottom’s acceleration is significantly larger than the top’s — so that the gap itself is provably widening faster — is a harder question to answer: the formal joint test on the change in the gap’s slope points the same direction (+0.43 points a year) but falls short of conventional significance (se=0.32, t=1.3).
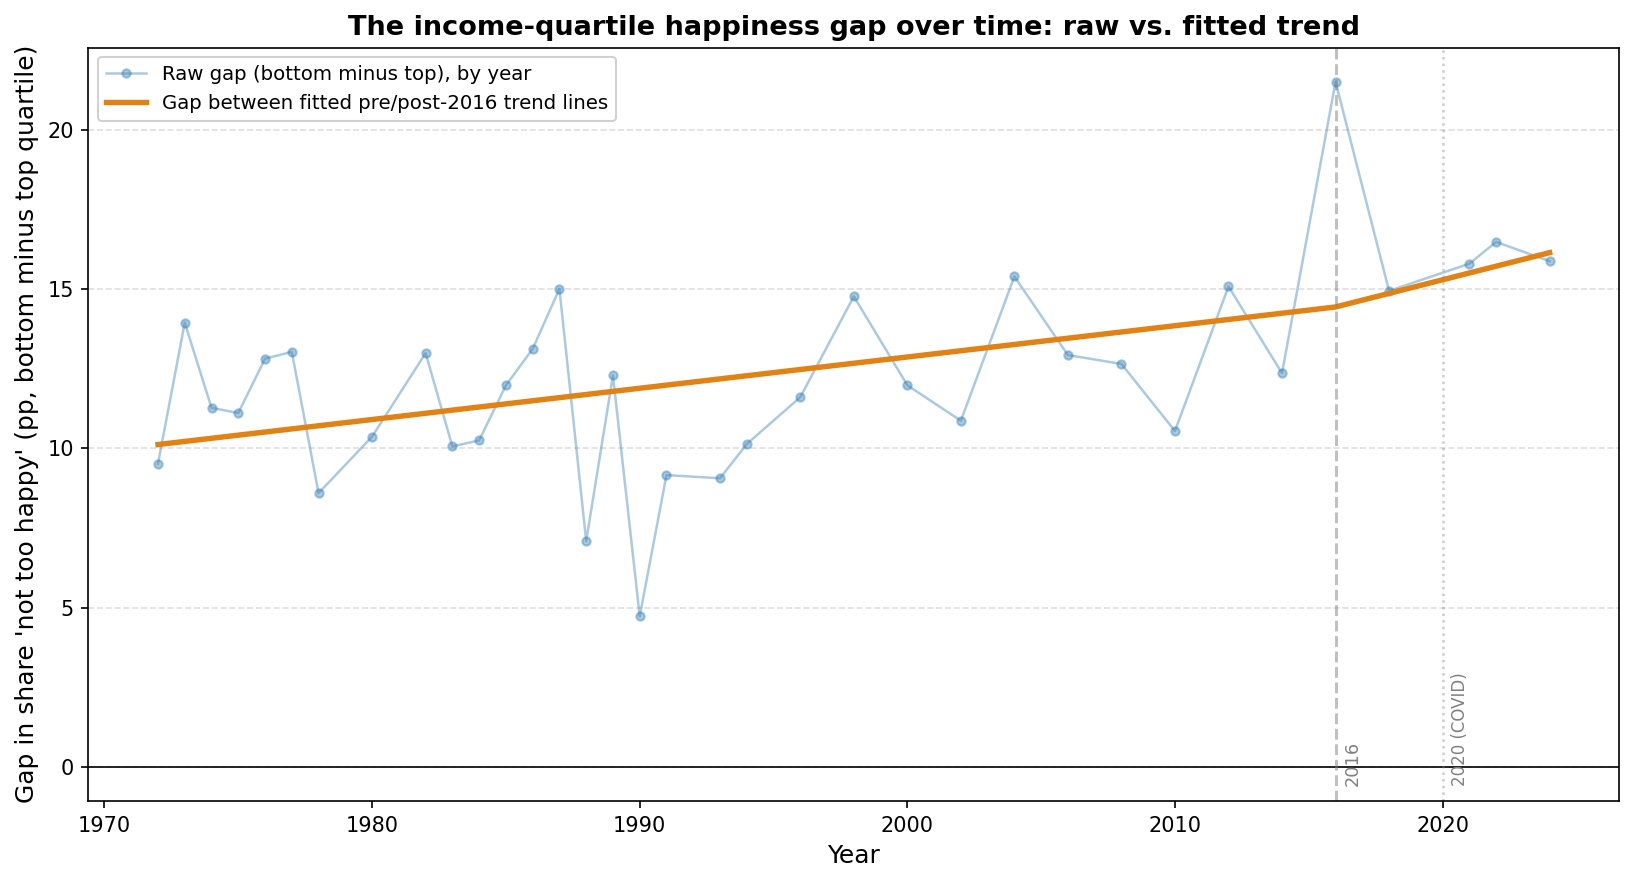
Plotting the gap itself — the bottom quartile’s unhappiness rate minus the top’s — shows the same suggestive-but-not-quite-there pattern: a simple (uncontrolled) fit of the gap widens at about 0.10 percentage points a year before 2016 and about 0.21 points a year after, but as above, this isn’t something that survives a formal test at conventional significance.
Which tail you track changes the answer
The unhappy measure above only tracks one end of the happiness scale — the share saying “not too happy.” It’s possible to miss something by doing that: if the top quartile is instead losing ground in the “very happy” category without a matching rise in “not too happy,” the unhappy share alone won’t show it. A more complete measure, used by economists studying happiness trends (e.g. Sam Peltzman), is net happiness: the share reporting “very happy” minus the share reporting “not too happy,” which moves if either tail moves.
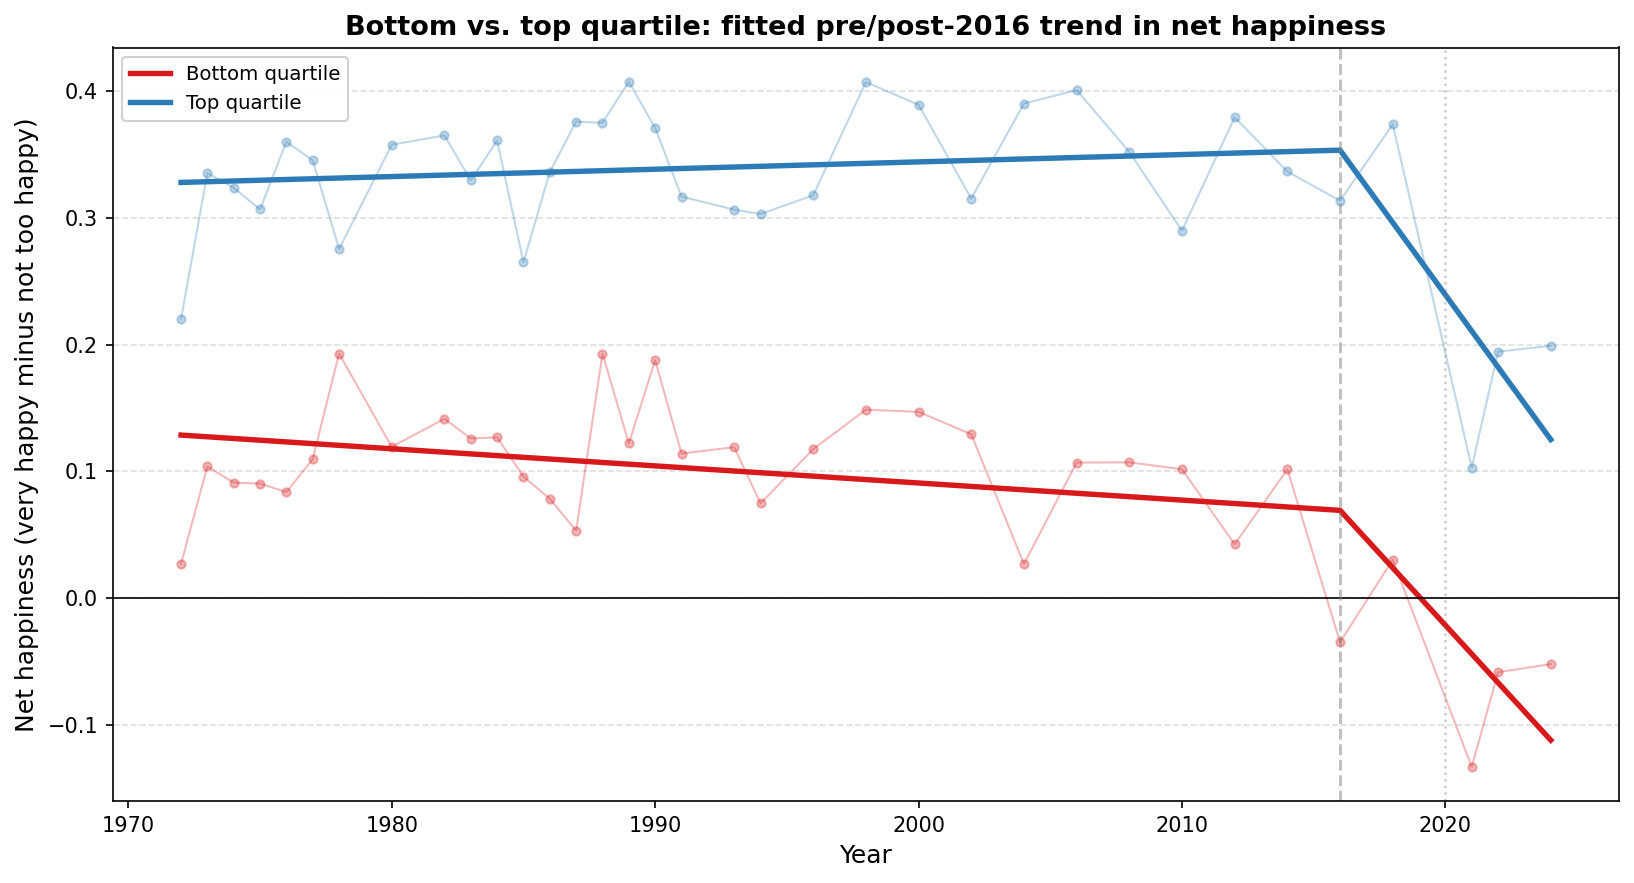
Redoing the trend-break test on net happiness changes the answer. Both quartiles decline sharply and by statistically indistinguishable amounts after 2016 — the bottom quartile’s net happiness falls by 2.61 points a year faster (se=0.41), the top quartile’s by 2.91 points a year faster (se=0.37), and the top’s point estimate is if anything slightly larger. The joint test on the gap’s slope change is +0.30 (se=0.55, t=0.5) — not remotely significant.
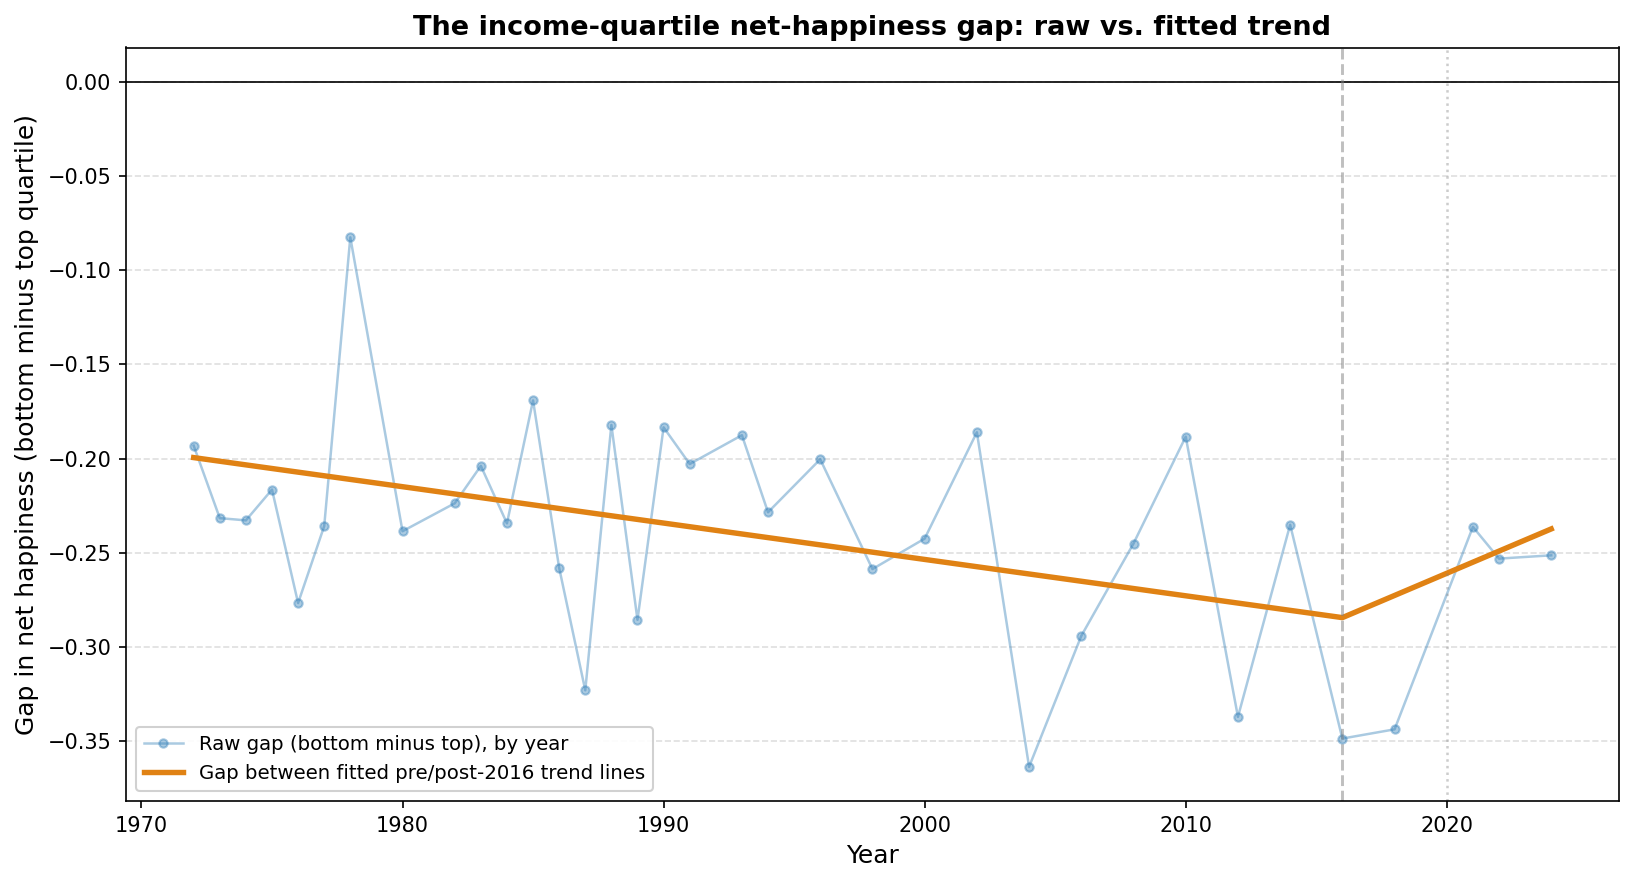
The fitted gap even ticks down slightly after 2016 (from -0.285 to -0.237 by 2024) rather than up, though this isn’t significant either. The honest summary: using a measure that tracks both tails instead of one, there’s no good evidence the income gap in happiness widened or narrowed after 2016. What’s really happening is that both income groups got much less happy together, largely in the COVID-era waves, and the standard unhappy-only measure’s suggestion of a widening gap doesn’t survive using a fuller measure of the same underlying data.
Trust in government and the press: a real crossover
Happiness and institutional trust measure different things, and it’s worth being explicit about the difference. A person can be unhappy with their own life for reasons that have nothing to do with politics — health, relationships, a bad year at work — while still trusting the government to do its job; conversely, someone whose material life is going fine can become newly alienated from institutions after their preferred party loses power, without becoming any less happy day to day. So it’s a genuinely separate question whether the income gradient in institutional trust follows the same pattern as happiness, and here the GSS data hold up better.
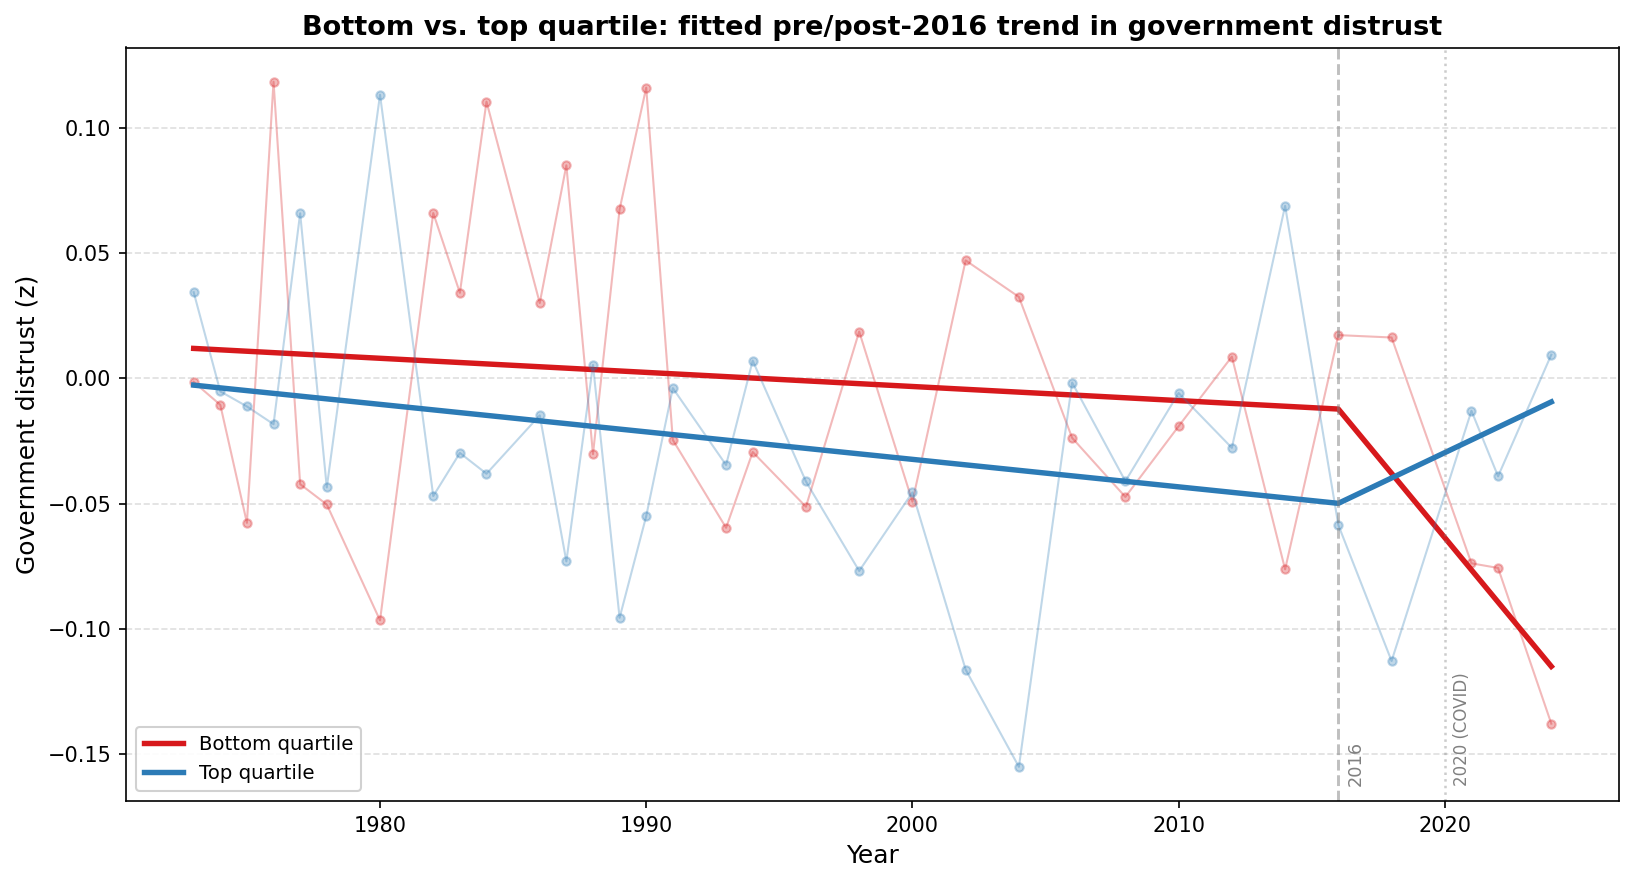
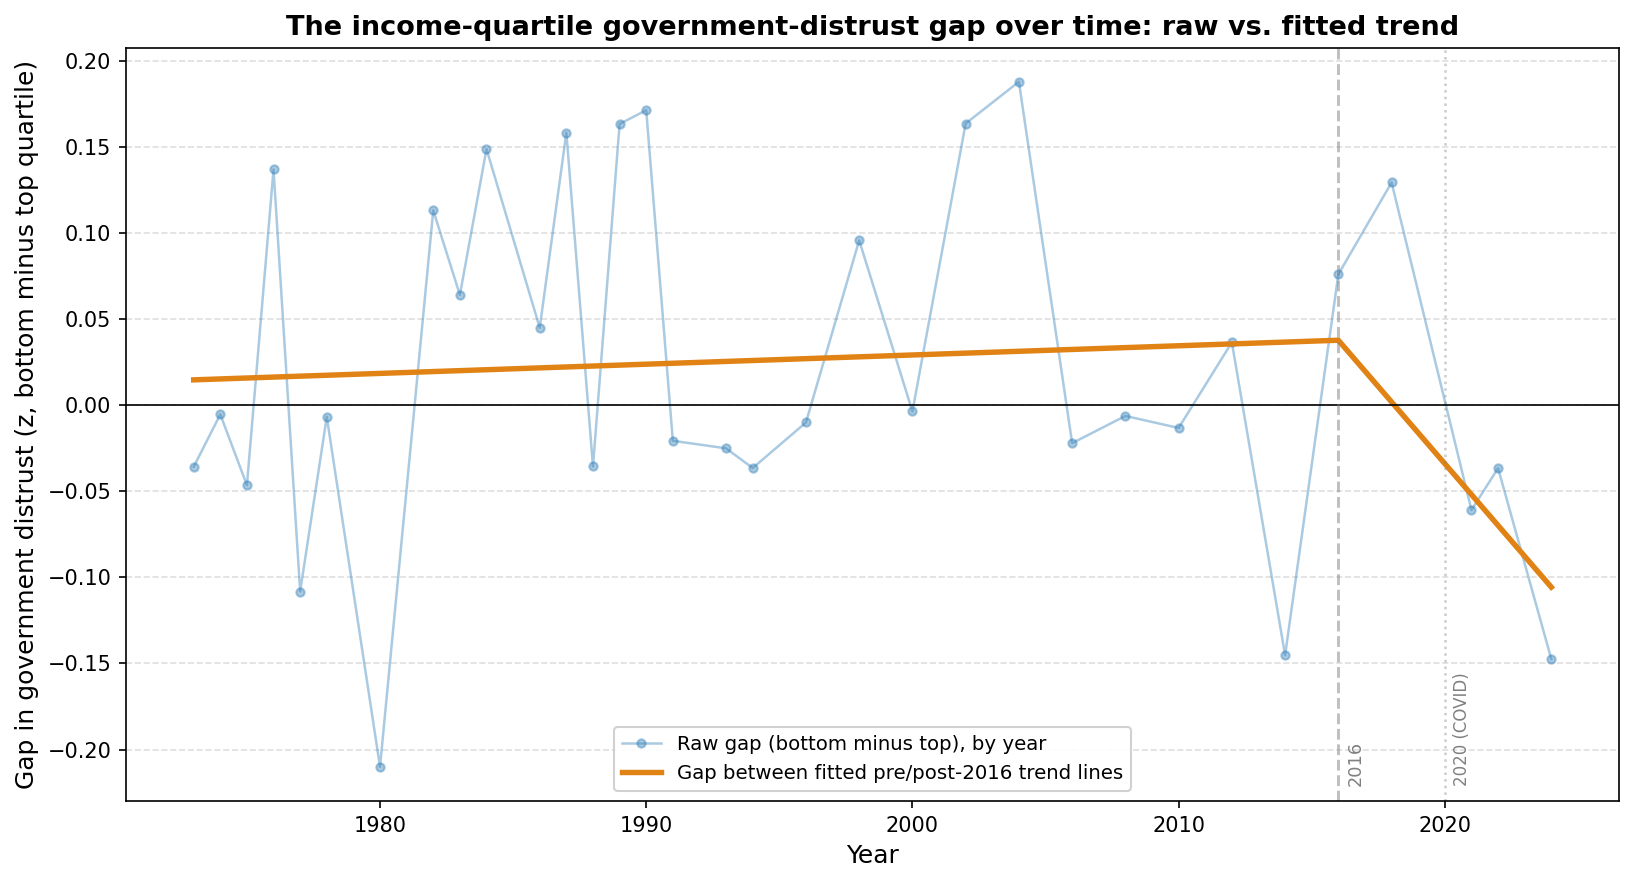
For a distrust index built from confidence in the federal government, Congress, and the courts, both income quartiles show flat trends before 2016 (not statistically distinguishable from zero), sitting close to each other throughout. After 2016 they move in opposite directions: the bottom quartile becomes more trusting (distrust index’s slope falls by 1.42 points a year, se=0.65, t=-2.2) while the top quartile becomes more distrustful (slope rises by 0.67 points a year, se=0.56, t=1.2). The joint test on the gap’s slope change is significant (t=2.4).
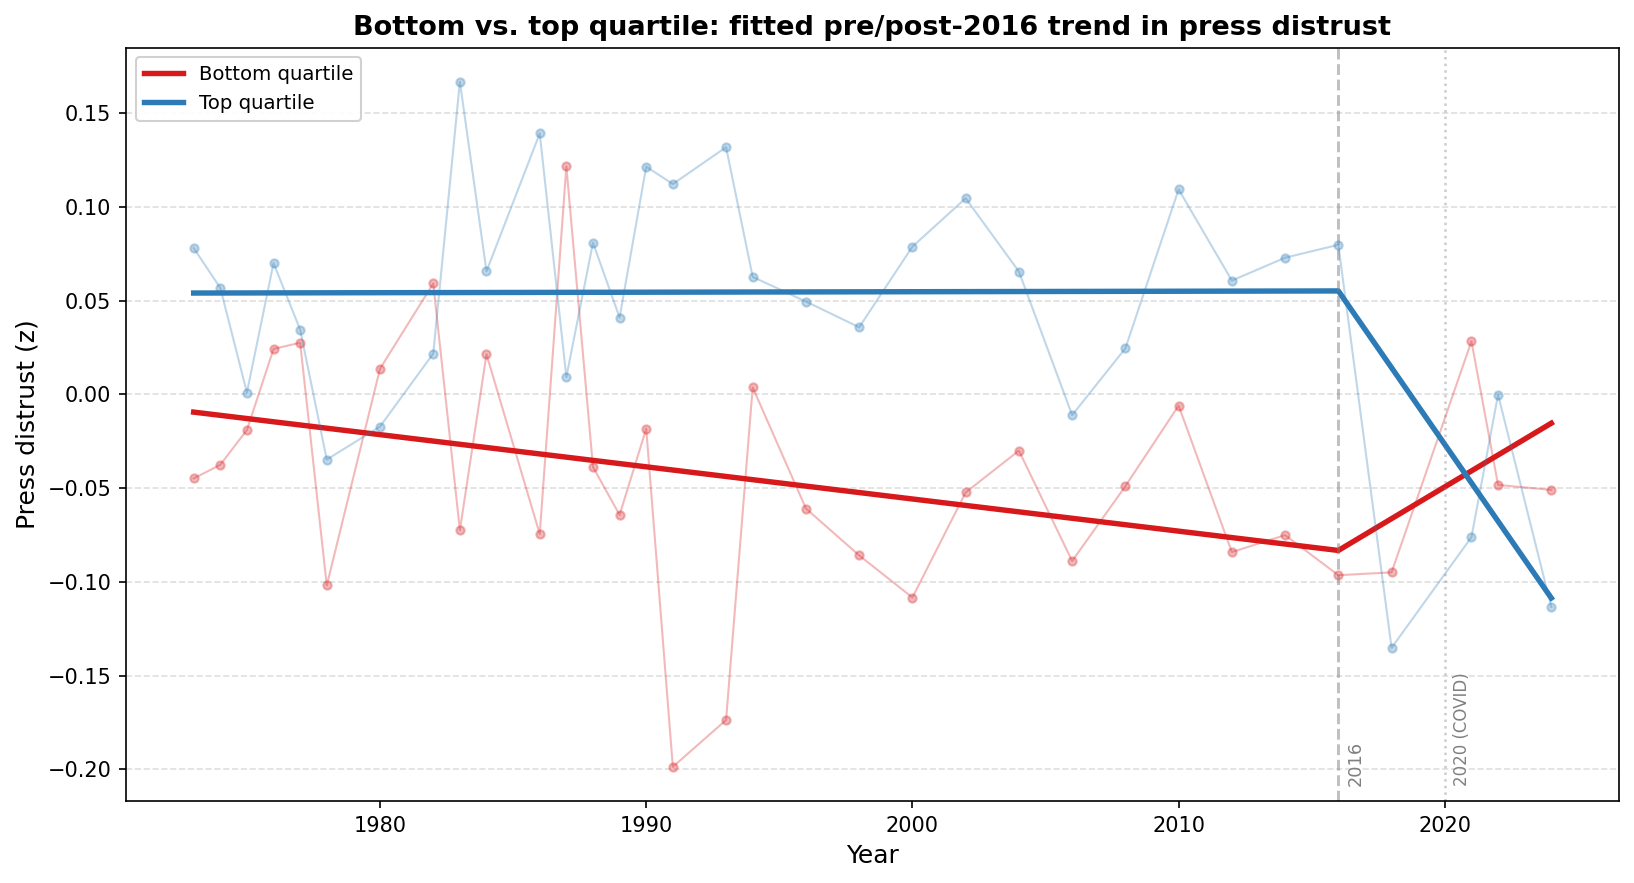
Distrust of the press shows the same crossover, more sharply and also significant (t=2.5). For decades the top quartile was consistently more distrustful of the press than the bottom quartile; after 2016 the top quartile’s distrust slope falls hard (by 2.06 points a year, se=0.75, t=-2.7) while the bottom’s ticks up slightly (by 0.60 points a year, se=0.74, not significant), and the two groups swap places.
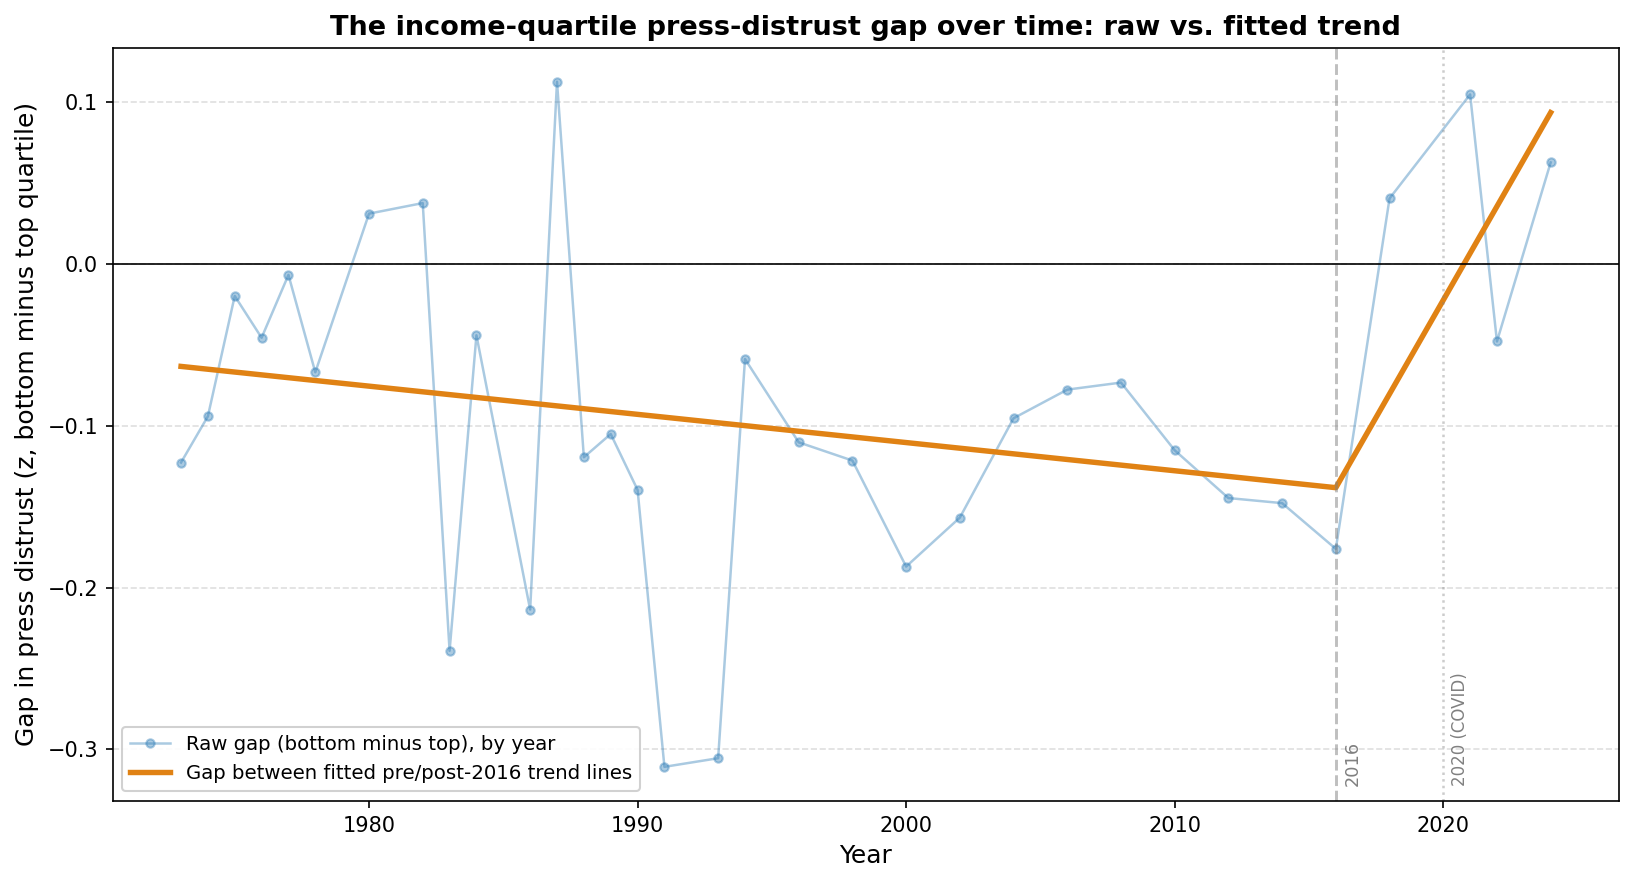
Both crossovers hold up when the underlying items are combined a different way — as a raw “share great deal minus share hardly any” net-confidence measure instead of a within-year standardized index, to rule out the standardization itself as the source of the pattern (government: gap-slope change +0.014, t=2.5; press: -0.018, t=-2.7, both same-signed and comparably significant as above).
Is this really about 2016?
The institutional-trust crossover is real, but a natural objection is that it looks a lot like ordinary partisan reaction to whoever holds power — and if income and party have been gradually realigning for decades, a similar (if smaller) reversal should show up around earlier changes in the party controlling the presidency, not just 2016.
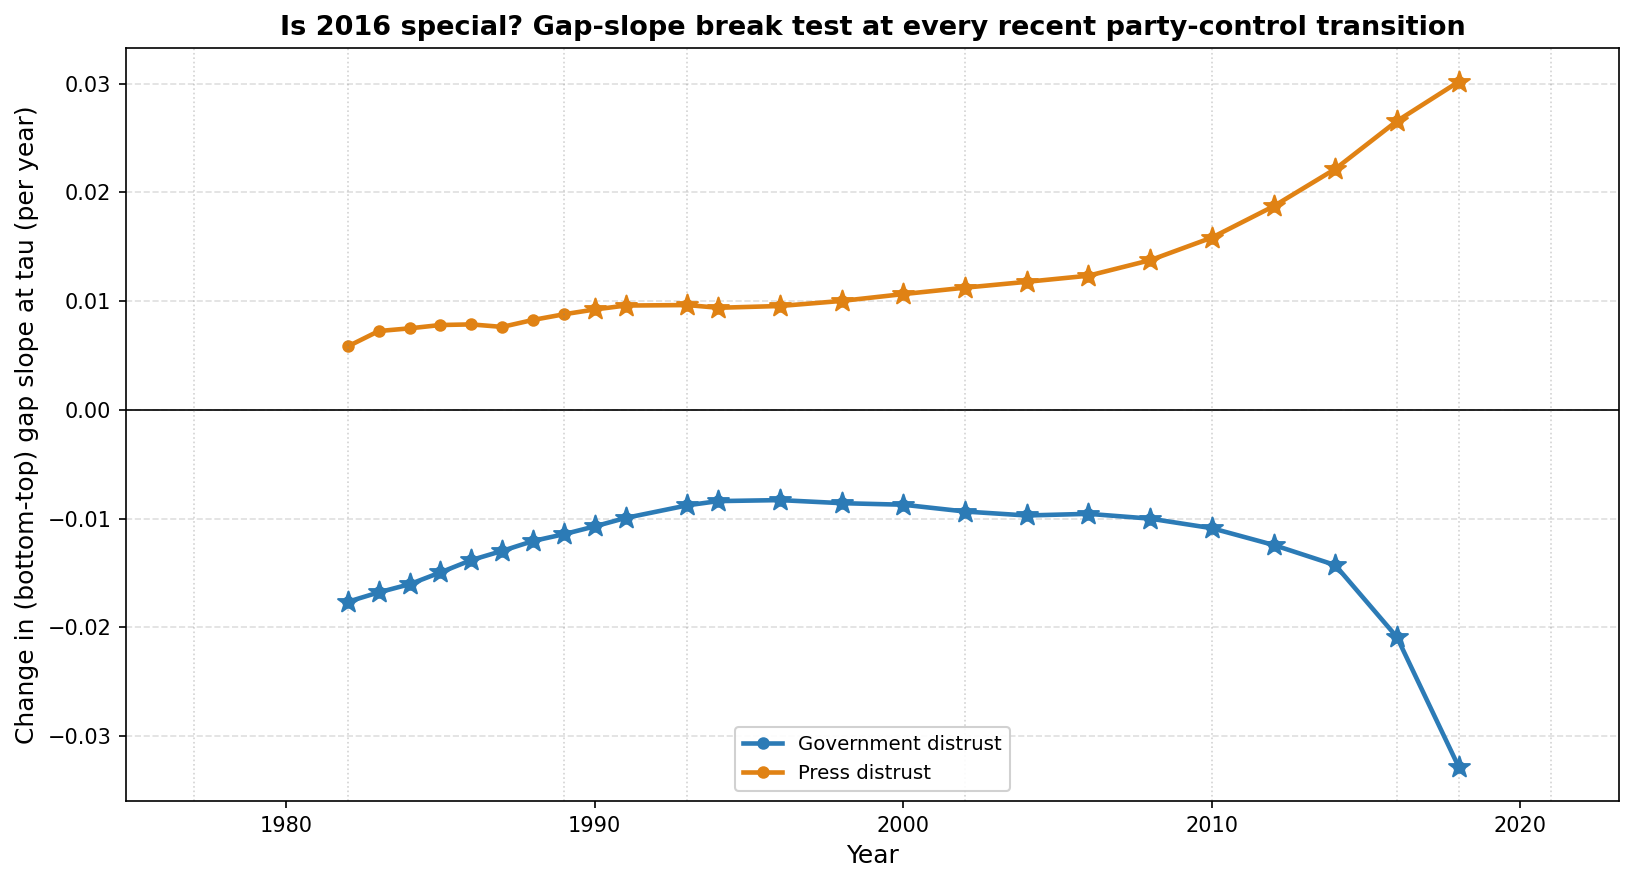
Rerunning the same break test at every GSS year from 1982 through 2018 as a candidate break point — including the years nearest Reagan’s, Bush Sr.’s, Clinton’s, Bush Jr.’s, and Obama’s transitions, not just Trump’s — answers this cleanly: the test is statistically significant at every candidate year in the window, and grows steadily in magnitude from 1982 through 2018 with no distinct peak at 2016. There isn’t enough data after 2018 to see whether the trend would eventually plateau or reverse. So 2016 is not a unique break; it’s the most recent and most visible stretch of a divergence between higher- and lower-income Americans’ institutional trust that had already been building, more weakly, since at least the 1980s. That’s consistent with a slow-moving realignment of income and party affiliation rather than a discrete reaction to the 2016 election specifically, though this analysis can’t distinguish those from a generic “each side trusts government less under the other party” mechanism without a partisan breakdown, which isn’t included here.
Data
Estimates use the General Social Survey (GSS) cumulative file, 1972-2024, weighted with wtssps (post-stratification weight). Unhappiness is the weighted share answering “not too happy” (vs. “pretty happy” / “very happy”); net happiness is the share “very happy” minus the share “not too happy.” Government and press distrust are standardized (within survey year) indices built from confidence items in the federal government/Congress/courts and the press, respectively, coded so higher values mean less confidence; net government/press confidence use the same items as a raw (unstandardized) share “a great deal” minus share “hardly any.” The confidence battery is asked of a rotating subset of respondents in most years, so its yearly sample is smaller and noisier than the happiness sample. Fitted trend lines are weighted least-squares fits of a piecewise-linear (kinked at 2016) trend; the group-vs-group significance tests additionally include demographic controls and cluster-robust standard errors (clustered on GSS’s survey design strata).
Reproducing this analysis
Code is available at mattsclancy/gss-income-happiness-divergence.
Related: Who Is Unhappy in America? finds a similar widening gap in happiness by age rather than income, with the same post-2012 acceleration.
Related: Feeling Below Average at the Median tracks the same subjective-income pessimism used here, broken down by income band instead of by top/bottom quartile.
Related: US happiness has fallen to record lows documents the aggregate decline that this post decomposes by income group.
Related: Can policy uncertainty explain the vibecession? finds the share of Americans saying the government is doing a poor job on economic policy rising from a 1985-2019 average of 30% to 65% in 2025-26 — a different window onto the institutional-trust shift traced here.