Does the Journalism Recession Make Economic News More Negative?
Since 1975, U.S. newspaper publishing employment rose from 376,000 to a peak of 474,000 in 1988-89, then collapsed to 82,000 by 2025 — an 83% decline from peak, even as total U.S. private employment nearly tripled over the same stretch. The “messenger class” hypothesis asks whether this shows up in the news itself: do the people producing economic coverage write more negatively about the economy when their own industry is unusually distressed, separate from how the broader economy is doing?
With macro conditions held constant, the answer is weakly yes for one way of measuring “distressed,” and no for another. The relationship is suggestive rather than conclusive, and the biggest reason is a data limitation rather than a null result: no publicly available dataset breaks U.S. economic-news sentiment down by newspaper or region, which is what a real test of this hypothesis needs.
Data
News sentiment comes from the San Francisco Fed’s Daily News Sentiment Index (Shapiro, Sudhof & Wilson), a lexicon-based score of economics coverage from 24 major U.S. newspapers, daily since 1980. The public release is a single national series — no outlet or geographic breakdown is available, and the underlying article corpus isn’t redistributed. Journalism employment comes from BLS’s Quarterly Census of Employment and Wages (QCEW), Newspaper Publishers industry, spliced across three classification vintages: SIC 2711 (1975-1989), NAICS 511110 (1990-2021), and NAICS 513110 (2022-2025, after a NAICS revision renumbered the industry). Macro controls (unemployment, inflation, real GDP growth, payroll growth, NASDAQ returns, NBER recessions) come from FRED.
Newspapers had their own recession, on a different clock than the rest of the economy
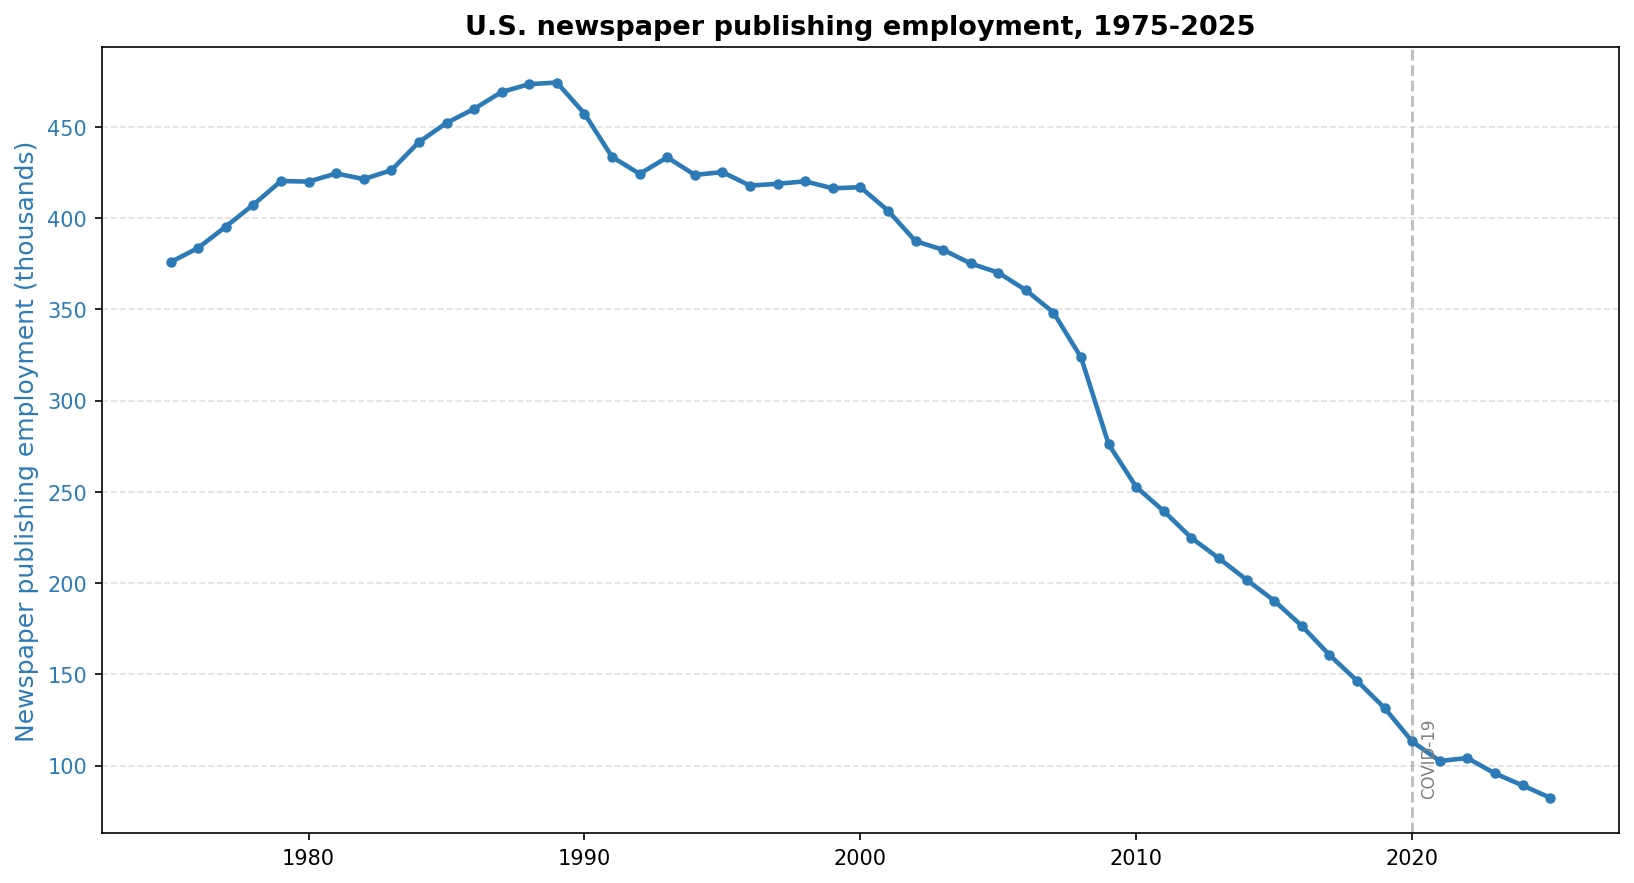
Newspaper employment grew for the better part of 15 years before turning over. The decline accelerates noticeably after 2007-08 and again through the 2010s, with no reversal after COVID.
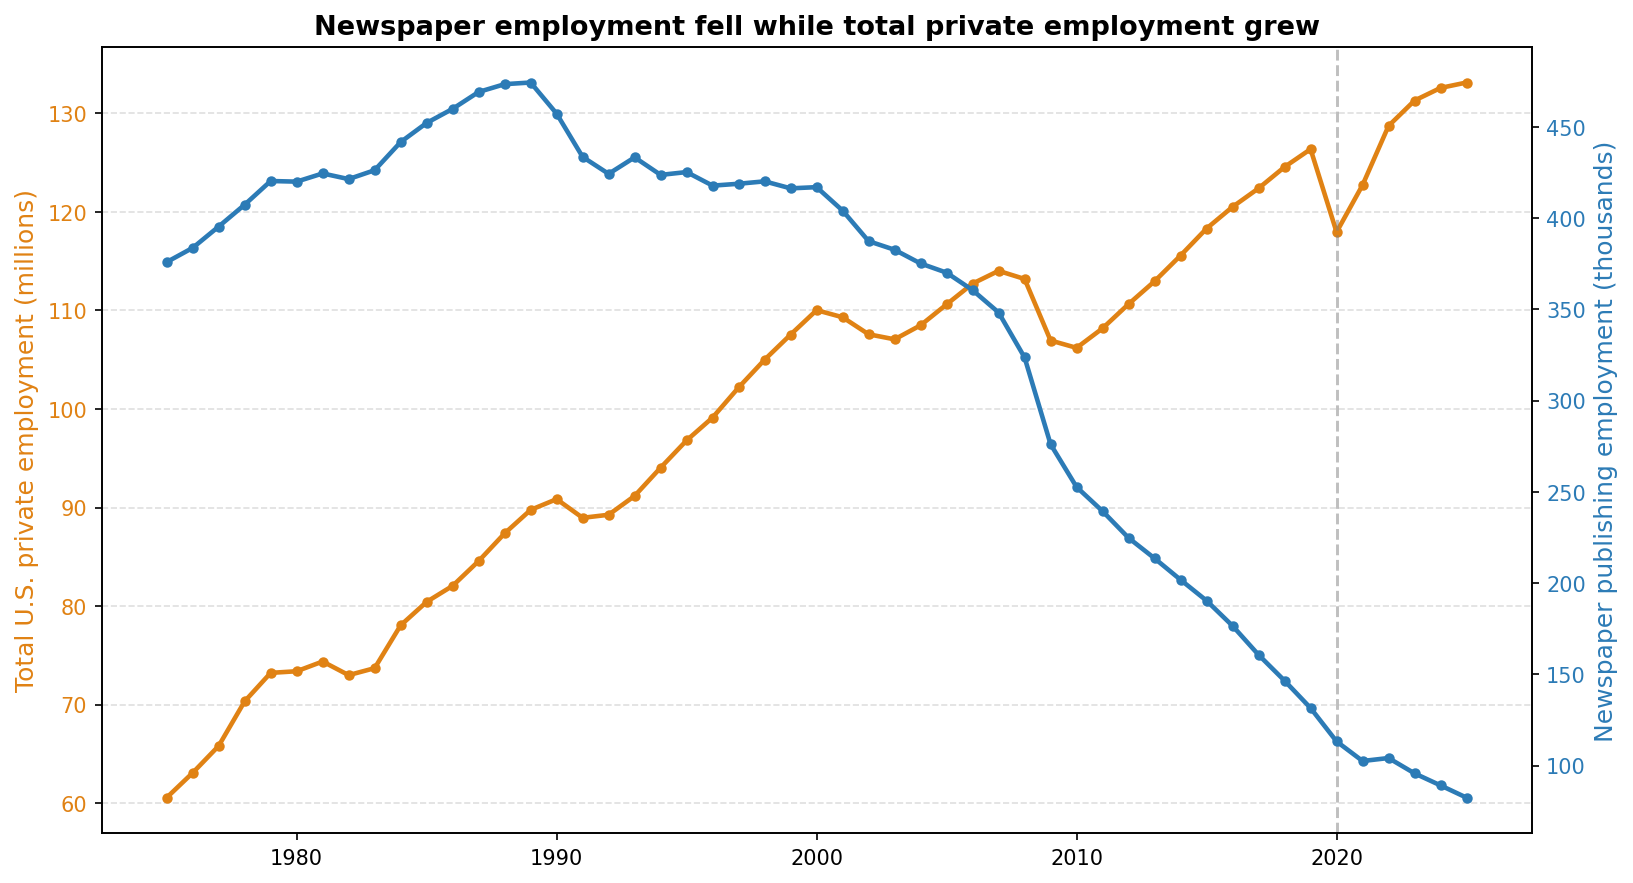
Set against total private employment, which grew in every decade shown, the newspaper decline is not a story about a bad economy — the surrounding labor market was doing fine, or better than fine, for most of this period. That gap between an industry’s own trajectory and its surrounding economy’s trajectory is the raw material for the messenger-class hypothesis.
Two ways to measure “journalism doing badly,” and they disagree
There are two natural ways to turn newspaper employment into a “how bad is journalism doing relative to everything else” variable, and they capture different things.
Relative growth asks how newspaper employment is moving this year, net of how the whole economy is moving: Δlog(newspaper employment) − Δlog(total private employment). If newspaper employment fell 5% in a year while total employment grew 2%, relative growth is about -7 log points for that year alone — a flow measure, reset every year.
Log employment share asks what fraction of the whole economy newspapers currently make up: log(newspaper employment) − log(total private employment). This is a stock measure — it remembers every year of decline that came before, not just the most recent one. Newspapers were already a shrinking share of total employment throughout the 1980s growth years, because the rest of the economy grew even faster; the share measure captures that, while the growth measure would show newspapers roughly holding their own.
This distinction turns out to matter for the results.
The regressions
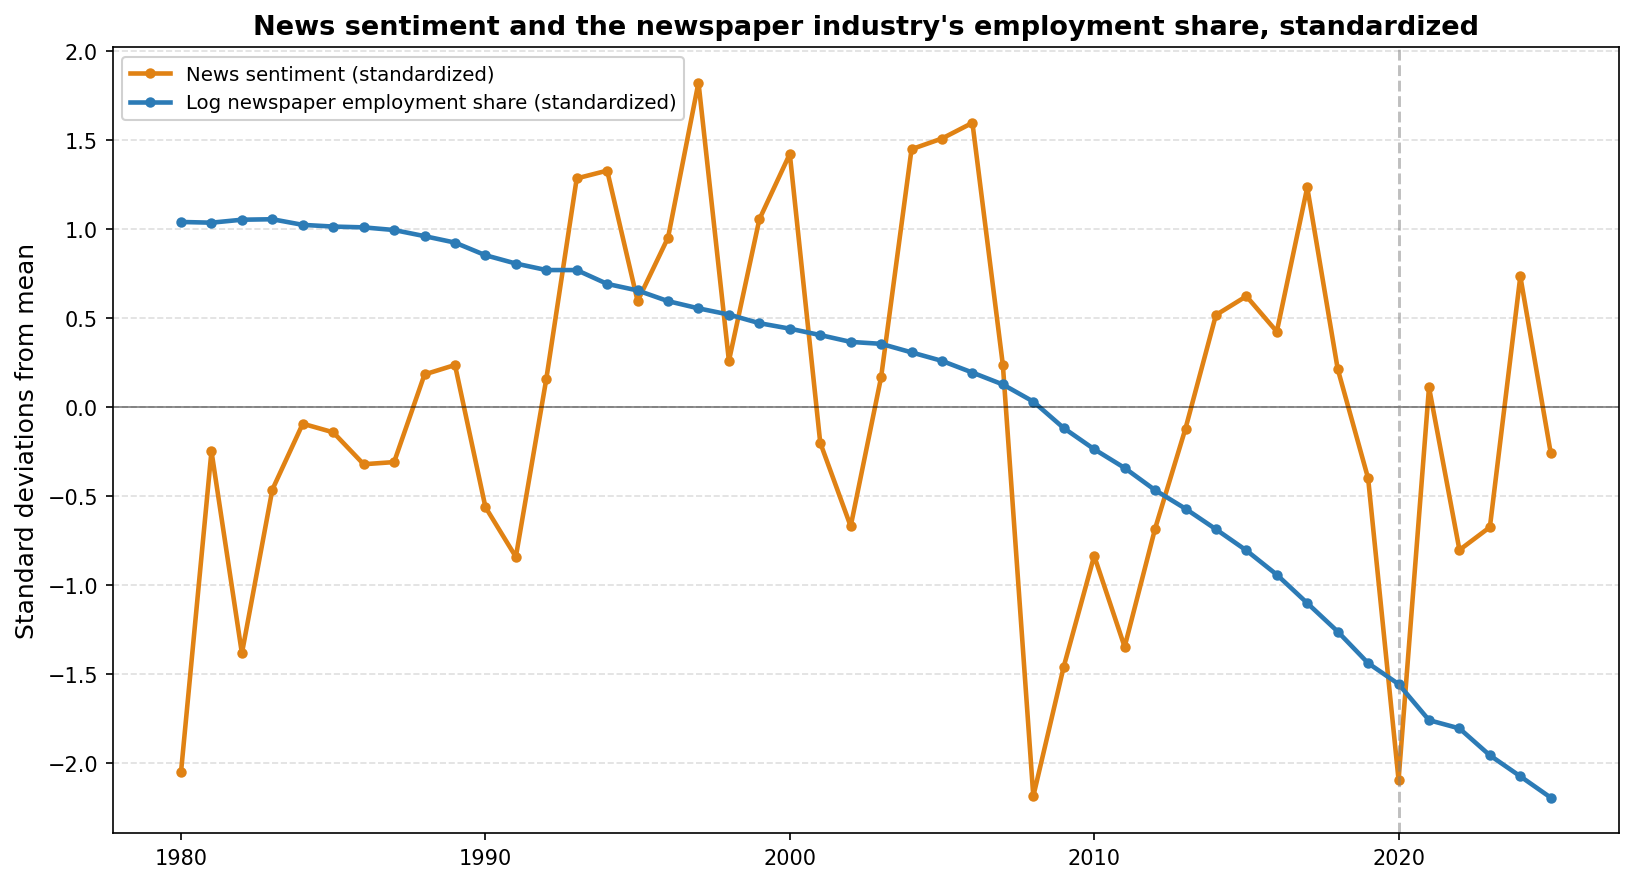
Both series trend down over the sample, sentiment much more noisily than the newspaper share. Raw correlation between the two is barely there (relative-growth measure: coefficient 0.29, not significant). But sentiment also moves with the ordinary business cycle, so the more informative test controls for that first.
| Specification | Journalism coefficient | Significant? | R² |
|---|---|---|---|
| Macro controls alone (no journalism term) | — | — | 0.58 |
| Raw: relative growth, no controls | 0.29 | no | 0.01 |
| Relative growth + macro controls | 1.18 | p<.01 | 0.64 |
| Relative growth + macro controls + linear trend | 0.81 | no | 0.64 |
| Log employment share + macro controls | 0.081 | p<.01 | 0.66 |
| Log employment share + macro controls + linear trend | 0.190 | p<.05 | 0.68 |
Unemployment, inflation, GDP growth, and stock returns all predict sentiment with the expected sign in the macro-only row, which is a reasonable check that the sentiment series and the control set behave sensibly before adding journalism to the mix.
Once macro conditions are held fixed, both journalism measures predict more negative sentiment in years newspapers do relatively worse. The relative-growth measure loses its significance once a simple linear time trend is added, though — consistent with two things that both trend downward over decades producing a correlation that has nothing to do with each other. The log-share measure survives the same trend control, and its coefficient actually gets larger.
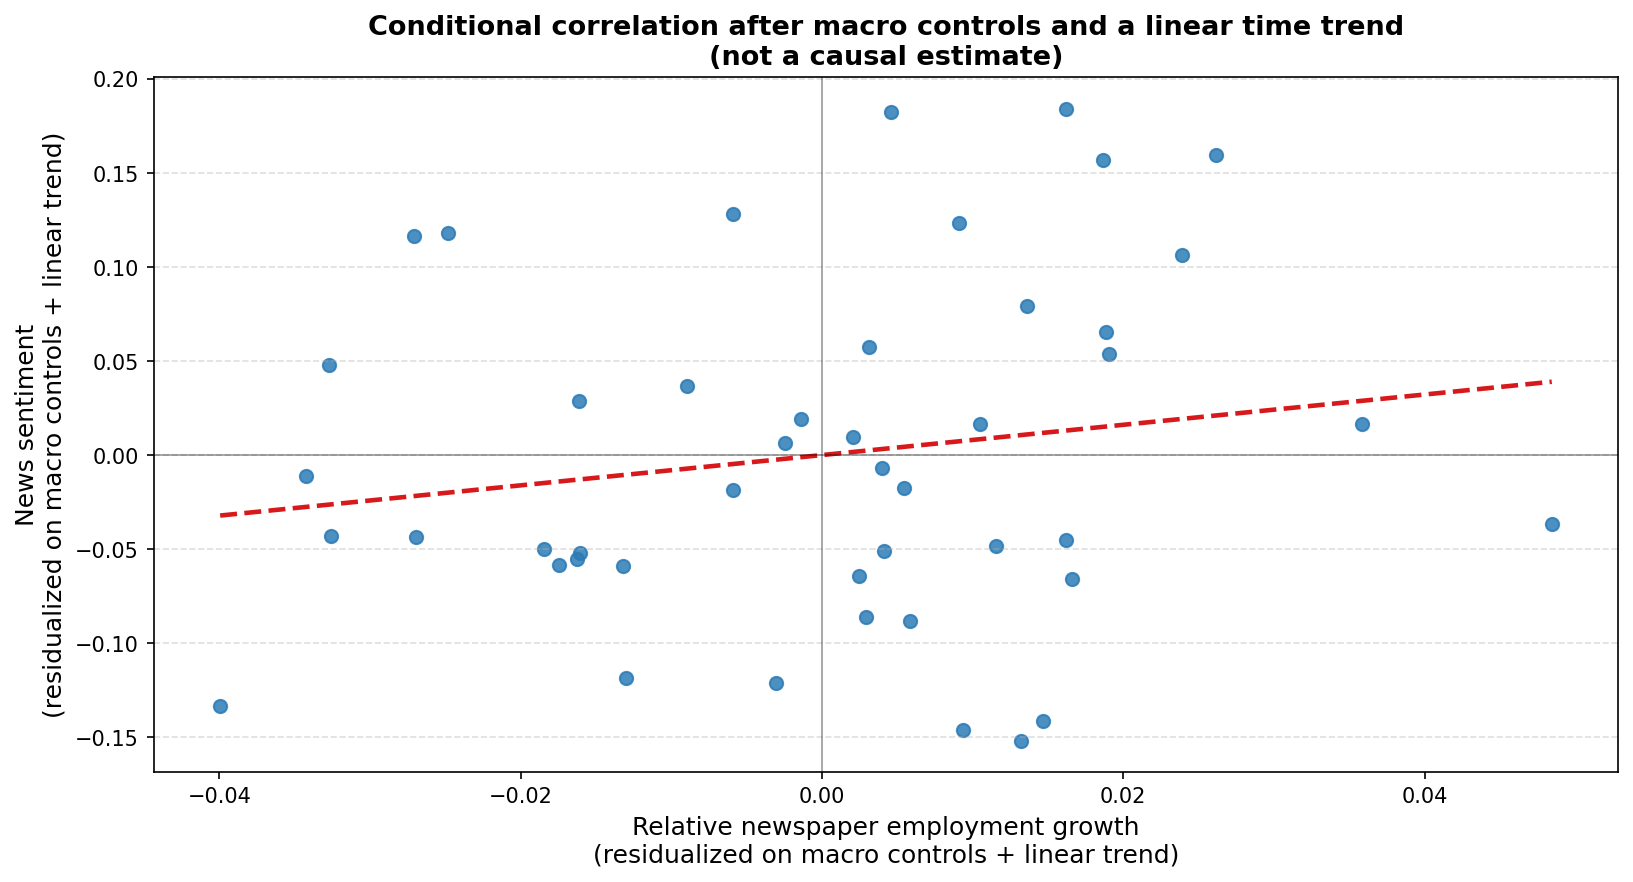
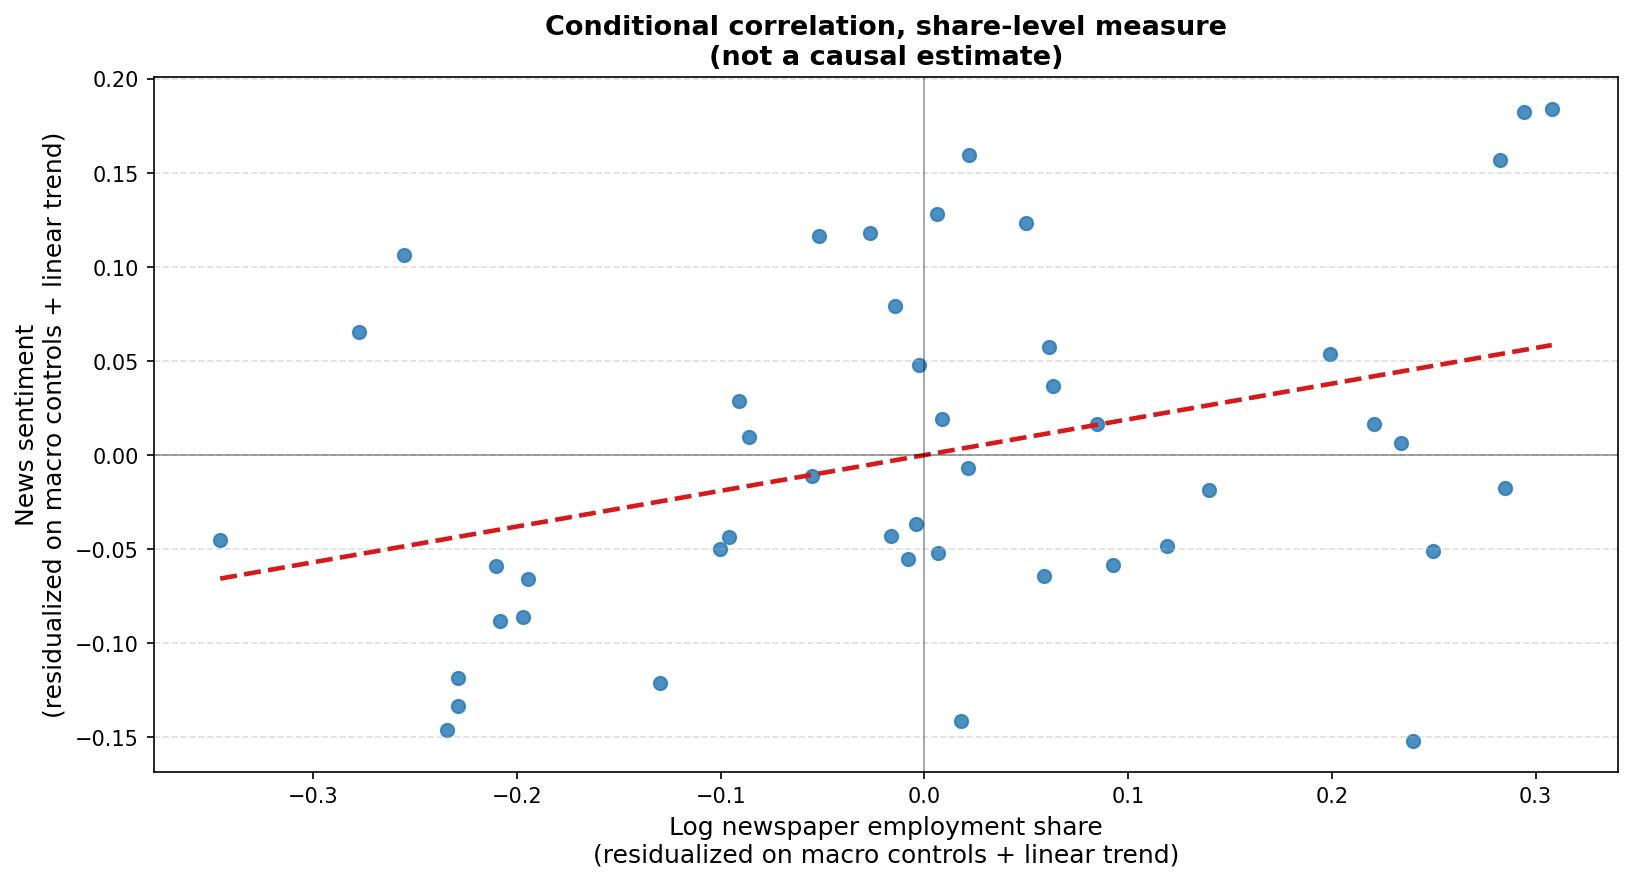
Plotting both series after removing macro conditions and a linear trend makes the difference visible: the relative-growth version is a flat, uncorrelated cloud; the log-share version has a modest positive slope, though still with plenty of scatter around it.
One more check argues for caution regardless of which measure is used. If newspaper employment growth next year predicts this year’s sentiment about as well as current or past growth does, that points toward newspaper employment and sentiment sharing some slow-moving common factor rather than journalism conditions feeding forward into coverage. That placebo test comes back significant here (coefficient 1.22, p<.05, similar in size to the contemporaneous relationship), which is not what a clean directional channel would look like.
Why this is suggestive rather than conclusive
The core problem with testing this hypothesis nationally is that a newspaper’s local economy and its own industry’s economy are entangled by construction: a national time series can’t tell “journalists infer the economy from their own industry’s distress” apart from “journalism’s industry and the broader economy just happen to move together for unrelated reasons.” Separating those two stories needs geographic variation — comparing places where the local newspaper industry is unusually distressed relative to that same place’s overall local economy, not just relative to the nation as a whole.
That data doesn’t currently exist in public form. The SF Fed index doesn’t disaggregate by outlet or region, and a promising alternative — Van Binsbergen, Bryzgalova, Mukhopadhyay & Sharma’s state-level news sentiment series, built from roughly 13,000 local newspapers back to the 1850s — doesn’t have its processed output publicly downloadable. Absent that, this post can describe a national correlation and note how fragile it is to specification choices, but it can’t distinguish a real messenger-class effect from newspapers and the broader economy simply sharing a long, slow decline in whatever this sentiment index is actually picking up.
Reproducing this analysis
Code and data are in the journalism-recession-news-sentiment repository, including the full regression sequence (leads/lags, recession exclusions, sub-period splits, a quarterly version of the series) and a findings.md write-up of what’s robust and what isn’t.
Dependencies
pip install pandas requests statsmodels matplotlib openpyxl
Data
QCEW and FRED data are downloaded by script; the SF Fed sentiment file and its replication code are checked into the repository directly.
Related: Have our expectations outpaced economic growth? asks the broader question this post’s mechanism speaks to: why measured wellbeing has diverged from measured economic conditions, using GSS data to show that the income level at which Americans report financial distress has risen faster than actual income since the mid-2000s.
Related: US happiness has fallen to record lows documents the wellbeing decline that a more negative news environment could plausibly be one input into, across the GSS, World Happiness Report, and Gallup.