Do Newspapers See the National Economy Through Their Hometown?
Drafted by Claude Code from an analysis I directed and reviewed.
A previous post found that national newspaper employment decline is weakly associated with more negative national economic-news sentiment — but a national time series can’t separate a real “messenger class” effect (journalists’ own industry distress bleeding into how they cover the economy) from two unrelated trends that happen to share a downward slope. This follow-up tests the idea with actual geographic variation: outlet-level economic-sentiment measures for 21 U.S. newspapers, matched to each paper’s own state economy and its own state’s newspaper-employment market, 1978-2015.
One thing to flag up front: “economic sentiment” here isn’t cleanly national. The underlying index scores every economy-related article a newspaper ran, local and national alike, and nothing in the data lets us separate the two — a local paper running more stories about its own city’s layoffs will look more “concerned” by this measure whether or not its coverage of the national economy specifically changed at all. This post calls it economic sentiment throughout for that reason, and comes back to what it means for interpretation below.
The results split in an informative way. When a newspaper’s home state’s economy is weak relative to the rest of the country that year, its economic sentiment gets more negative — a solid, robust relationship. There’s also a smaller, real effect from a newspaper’s own newsroom shrinking faster than its local economy — the sharper messenger-class test — but it’s modest in size, borderline by conventional standards, and it doesn’t show up at all when tested on the two clearly-national outlets in the sample (the New York Times and Washington Post) on their own. Read it as suggestive, not settled.
Data
Outlet-level economic sentiment comes from Hopkins, Kim & Kim (2017), “Does Newspaper Coverage Influence or Reflect Public Perceptions of the Economy?” (Research & Politics), whose replication data provided exactly the outlet × month panel this design needs: a monthly dictionary-based “economic concern” index (negative-word frequency minus positive-word frequency — higher means more negative/concerned) for 24 outlets, 1978-2016. This analysis uses the 21 that are newspapers with a real home labor market — dropping two broadcast outlets (ABC News, CBS News) and USA Today, which has no single hometown to test against. The New York Times and Washington Post are reassigned from Hopkins et al.’s own “nationwide” classification to New York and DC specifically so they can be tested against real home-market conditions. Despite a completely different construction method and no overlapping outlet sample, this index correlates strongly with the SF Fed sentiment series used in the previous post (r≈0.75 over their 36 overlapping years, sign-flipped for the two indices’ opposite conventions) — a reassuring sign both are picking up much the same underlying signal.
Journalism and total private employment by state come from BLS’s Quarterly Census of Employment and Wages (QCEW), same three classification vintages as the previous post (SIC 2711 / NAICS 511110 / NAICS 513110). State unemployment rates come from FRED. Geography is state-level rather than metro-level — Hopkins et al. themselves treat local papers at the state level, and it’s a reasonable simplification for a panel this size.
Local newspaper markets didn’t decline on the same clock
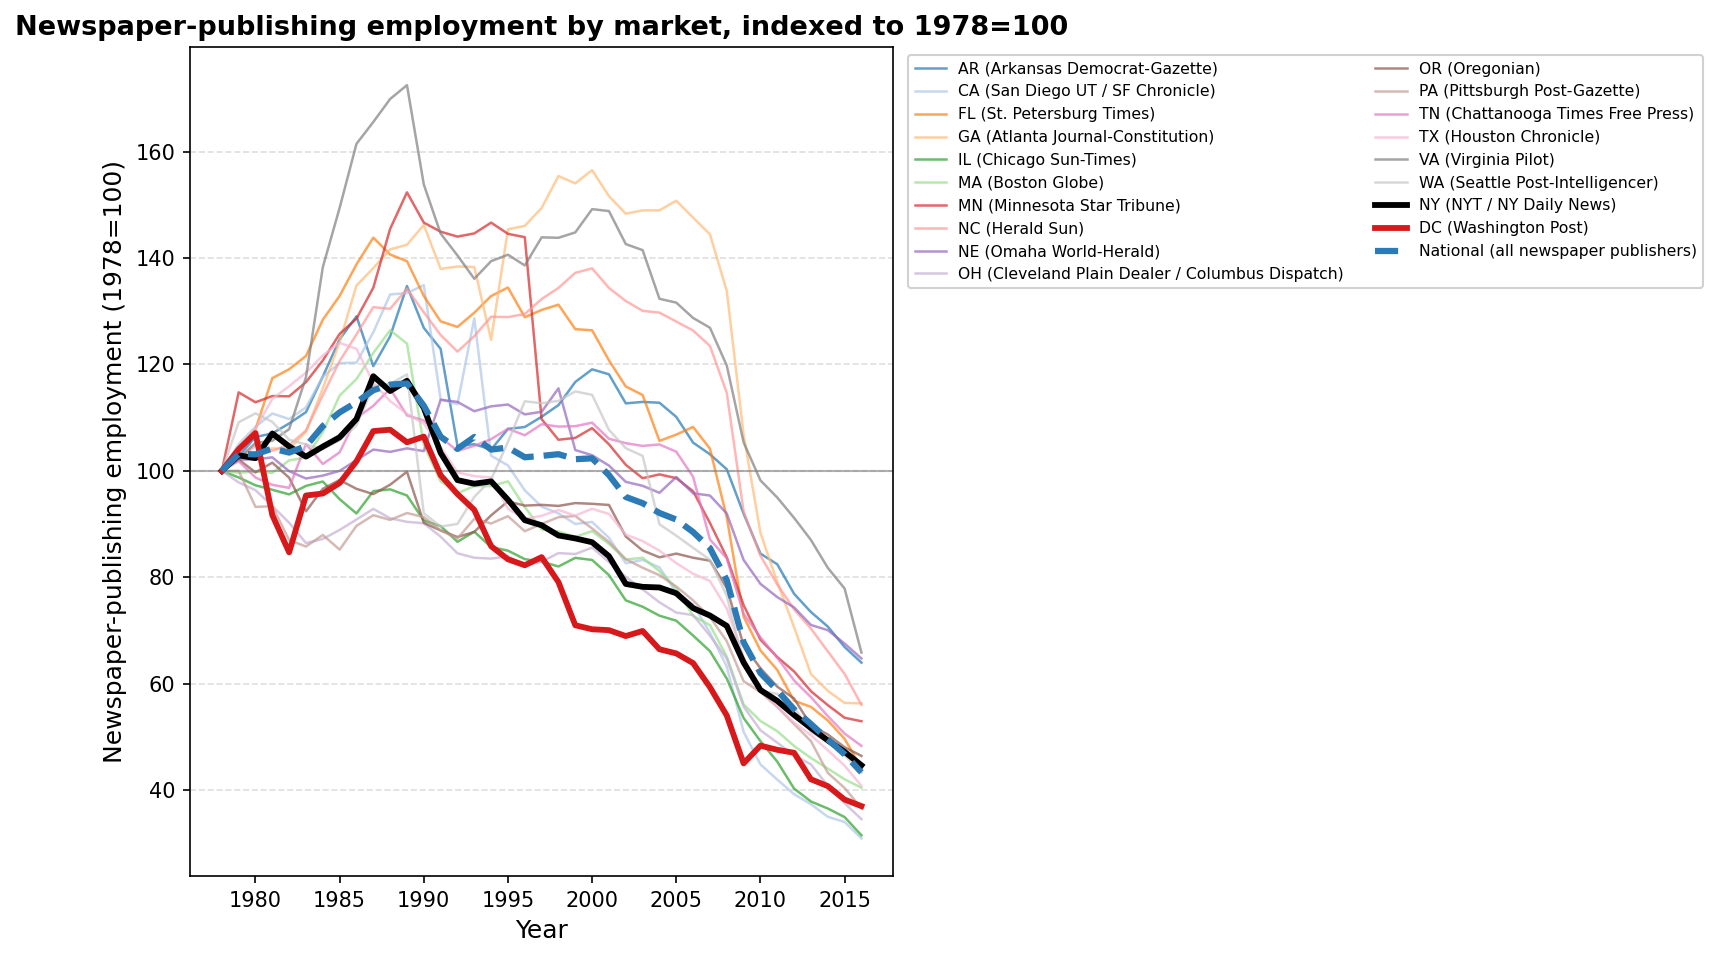
Indexing each state’s newspaper-publishing employment to its own 1978 level shows real cross-market variation in both timing and magnitude. Virginia, Georgia, and Minnesota’s newspaper employment climbed to 140-170% of 1978 levels through the late 1980s and 1990s before declining, while New York and DC — home to the Times and the Post — tracked close to the national index for the whole period, declining fairly steadily from the late 1980s on. By the mid-2010s most states converge into a similar 35-65%-of-1978 range despite very different paths to get there. That divergence in timing and magnitude is the raw material the panel below uses.
Does a newspaper’s own newsroom shrinking predict more negative economic sentiment?
The design is a newspaper × year panel with newspaper and year fixed effects:
EconomicConcern_it = α_i + γ_t + β1·LocalEconGrowth_it + β2·JournalismGrowth_it + ε_it
where α_i is a newspaper fixed effect, γ_t a year fixed effect, LocalEconGrowth_it is the newspaper’s state’s total private employment growth that year, JournalismGrowth_it is that state’s newspaper-publishing employment growth that year, and ε_it is an error term clustered by newspaper. Neither variable is pre-differenced against a national or local benchmark — the year fixed effects already absorb anything common to every newspaper in a given year (national GDP, national unemployment, national political events, any shared shift in how “concerned” economic sentiment sounds), so building that benchmarking into the regressors themselves would be redundant. What’s left is comparisons like: in a given year, was this newspaper more negative than others, when its own state’s economy or its own state’s newspaper industry was unusually weak that year?
| Regressor | Coefficient | Clustered SE | p |
|---|---|---|---|
LocalEconGrowth (β1) |
-7.48 | 2.45 | 0.002 |
JournalismGrowth (β2) |
-0.89 | 0.46 | 0.052 |
Both point the expected direction: weaker conditions, more negative sentiment. The local-economy relationship is the larger and more precisely estimated of the two, and holds up everywhere it’s tested below. The journalism-specific relationship — the sharper test, since it isolates a newspaper’s own industry from the city around it — is real but smaller and sits right at the edge of conventional significance.
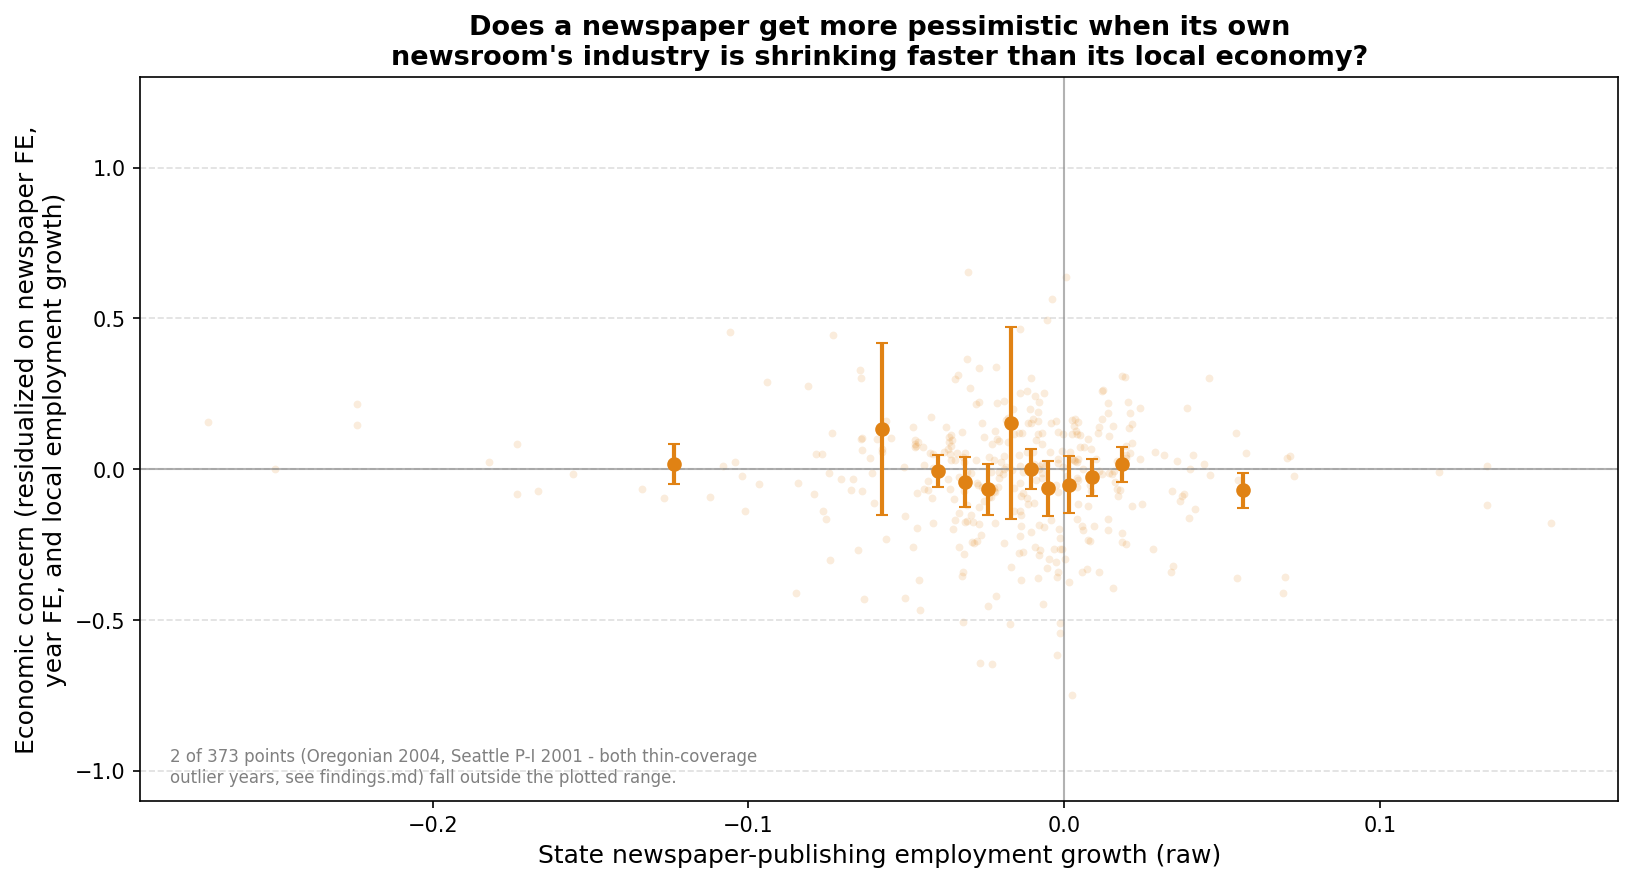
The underlying scatter is noisy — appropriately so, given the p-value — but the binned means trend downward as journalism employment growth improves, most visibly through the middle of the distribution where most of the data sits.
How much does this matter in practice? Take 2002, a year when the New York Times’s newsroom shrank 6.4% while the Washington Post’s DC newsroom actually grew slightly — a roughly 5-point gap, about the size of a typical (one-standard-deviation) swing in this variable across the panel. Applying the coefficient above to that gap alone predicts the Times’s sentiment should read about 0.043 points more negative than the Post’s that year — roughly a fifth of a standard deviation of the within-panel variation in economic concern. The actual gap that year: the Times came in 0.036 points more negative than the Post — close to what the model implied.
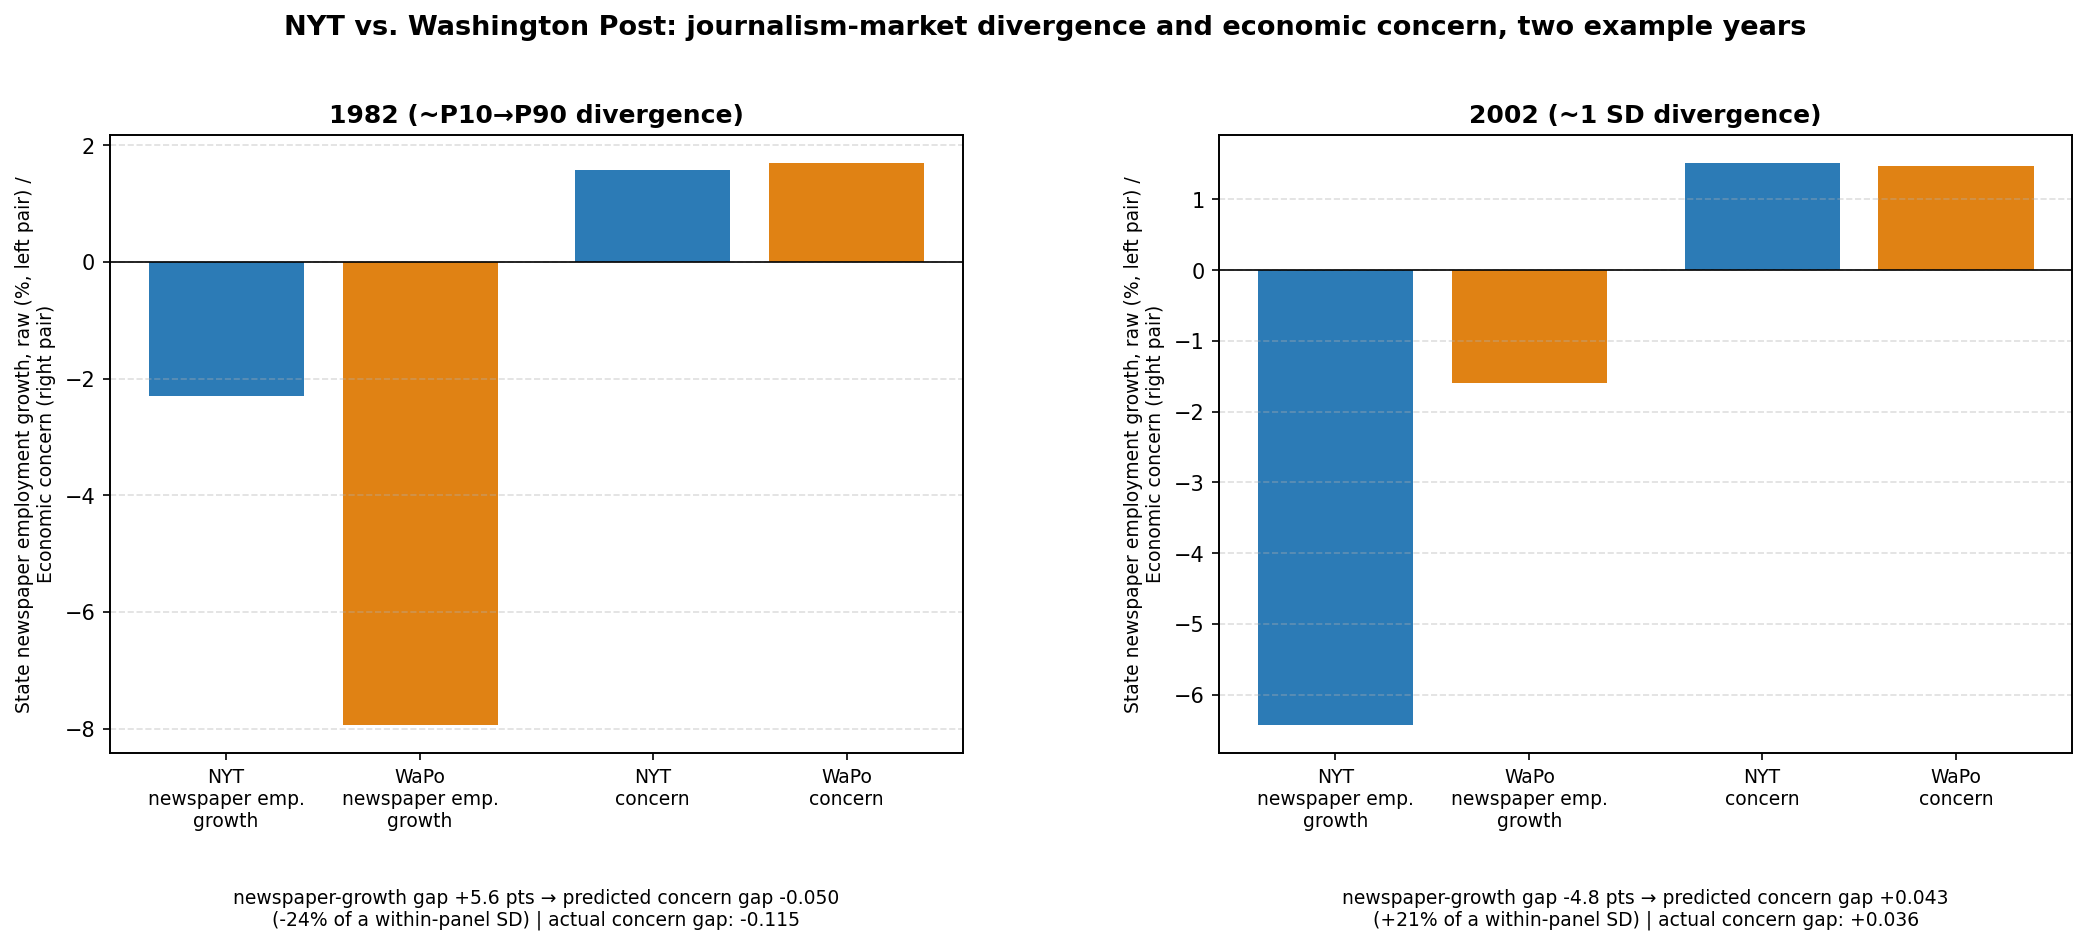
That example is a useful gut check on size, but it comes with an important asterisk: the coefficient it uses is estimated overwhelmingly off local papers — 19 of the 21 newspapers in the sample. When the New York Times and Washington Post are analyzed on their own, using only their own 73 combined newspaper-years, the journalism-specific coefficient flips sign and loses any statistical support (+0.61, not significant, vs. -1.16, p≈0.03, for the 19 local papers). That’s exactly the cleaner test this design was meant to enable, since these two papers’ content is genuinely dominated by the national economy rather than local stories about their own city’s downturn — and on that harder test, the effect doesn’t independently replicate. The most defensible reading: local papers’ economic sentiment may partly reflect them running more stories about their own city’s economic troubles, not necessarily journalists’ personal experience coloring how they see the national economy specifically. Hopkins et al.’s replication data doesn’t include article-level metadata that would let us separate national- from local-economy stories directly, so this remains an open limitation rather than something resolved here.
Robustness and other checks
Growth vs. share, reversed from the national analysis. The previous post found the opposite pattern: there, the employment-share (stock) measure survived a linear-trend control while the growth (flow) measure didn’t. Here, growth is what’s significant and trend-robust, while the share measure (log(newspaper employment) − log(total employment)) is flat and null in every specification (coefficient 0.04, p=0.89). Same underlying industry, same two measures, opposite one “works” — plausibly because a national trend absorbs slow-moving drift (which favors the stock measure, since drift is what it is), while this panel’s year fixed effects already absorb the shared national drift, leaving the flow measure to do the useful work in cross-market comparisons.
Timing. The previous post’s biggest weakness was a placebo problem: future national journalism employment predicted current sentiment about as well as the present did, which undermined any directional story. Repeating that test here is the most reassuring result in this analysis:
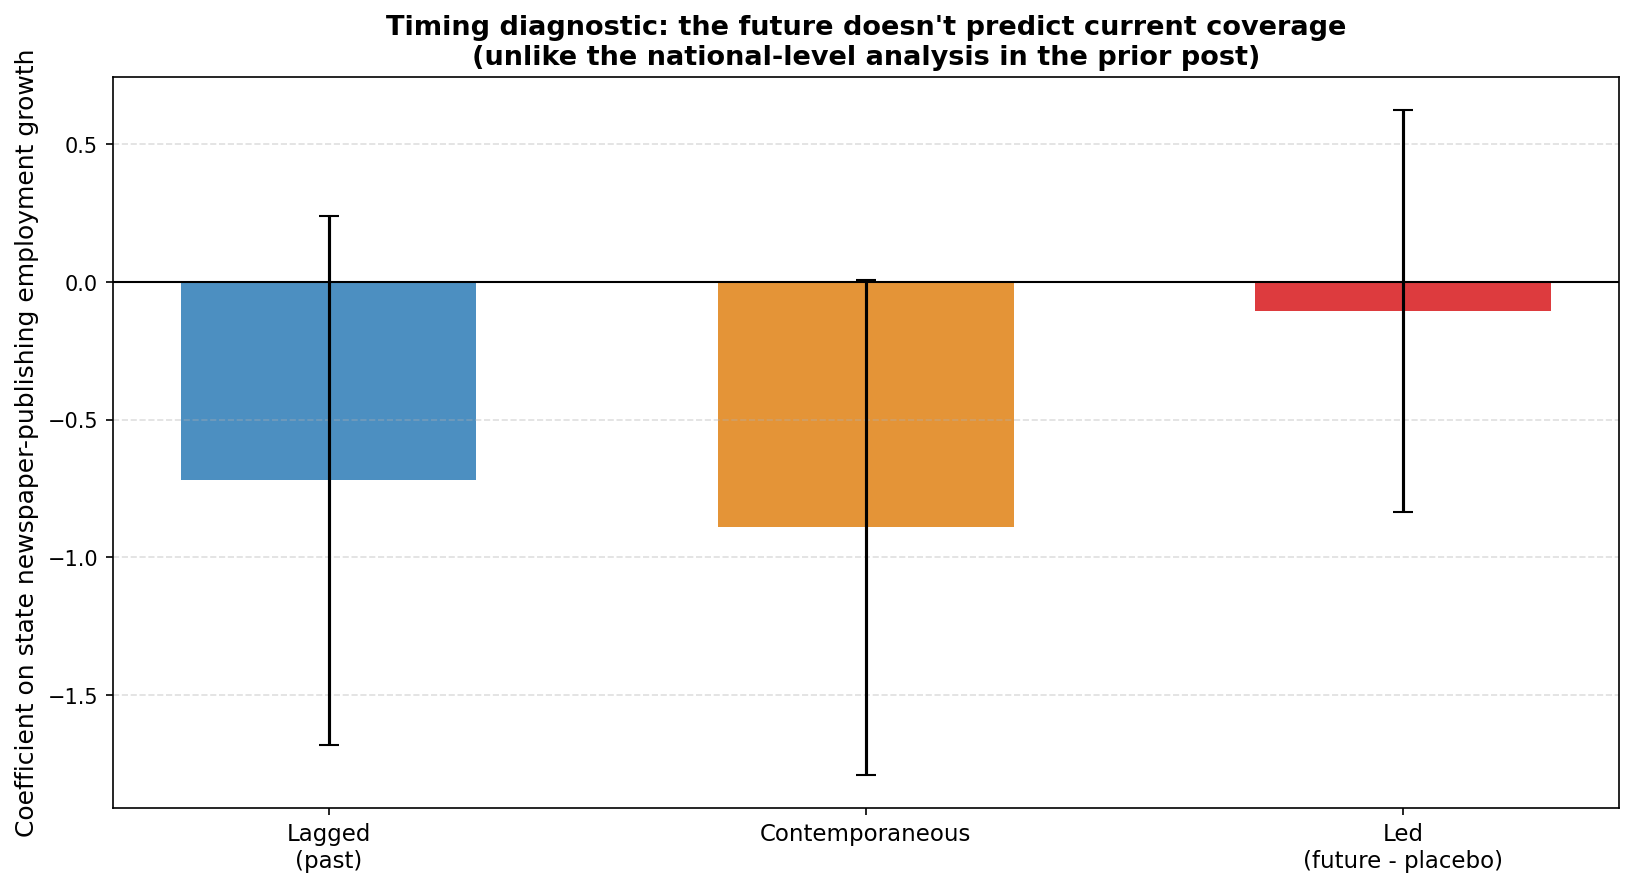
Contemporaneous journalism growth: -0.89 (p=0.052). One year lagged: -0.72 (p=0.14). One year led — next year’s journalism conditions “predicting” this year’s sentiment, the placebo test — comes in at -0.11 and is nowhere near significant (p=0.78). Unlike the national analysis, the future doesn’t predict the present nearly as well as the present does.
Stability. Dropping each of the 21 newspapers one at a time, the journalism coefficient stays in a narrow band (-1.13 to -0.50) and never flips sign:
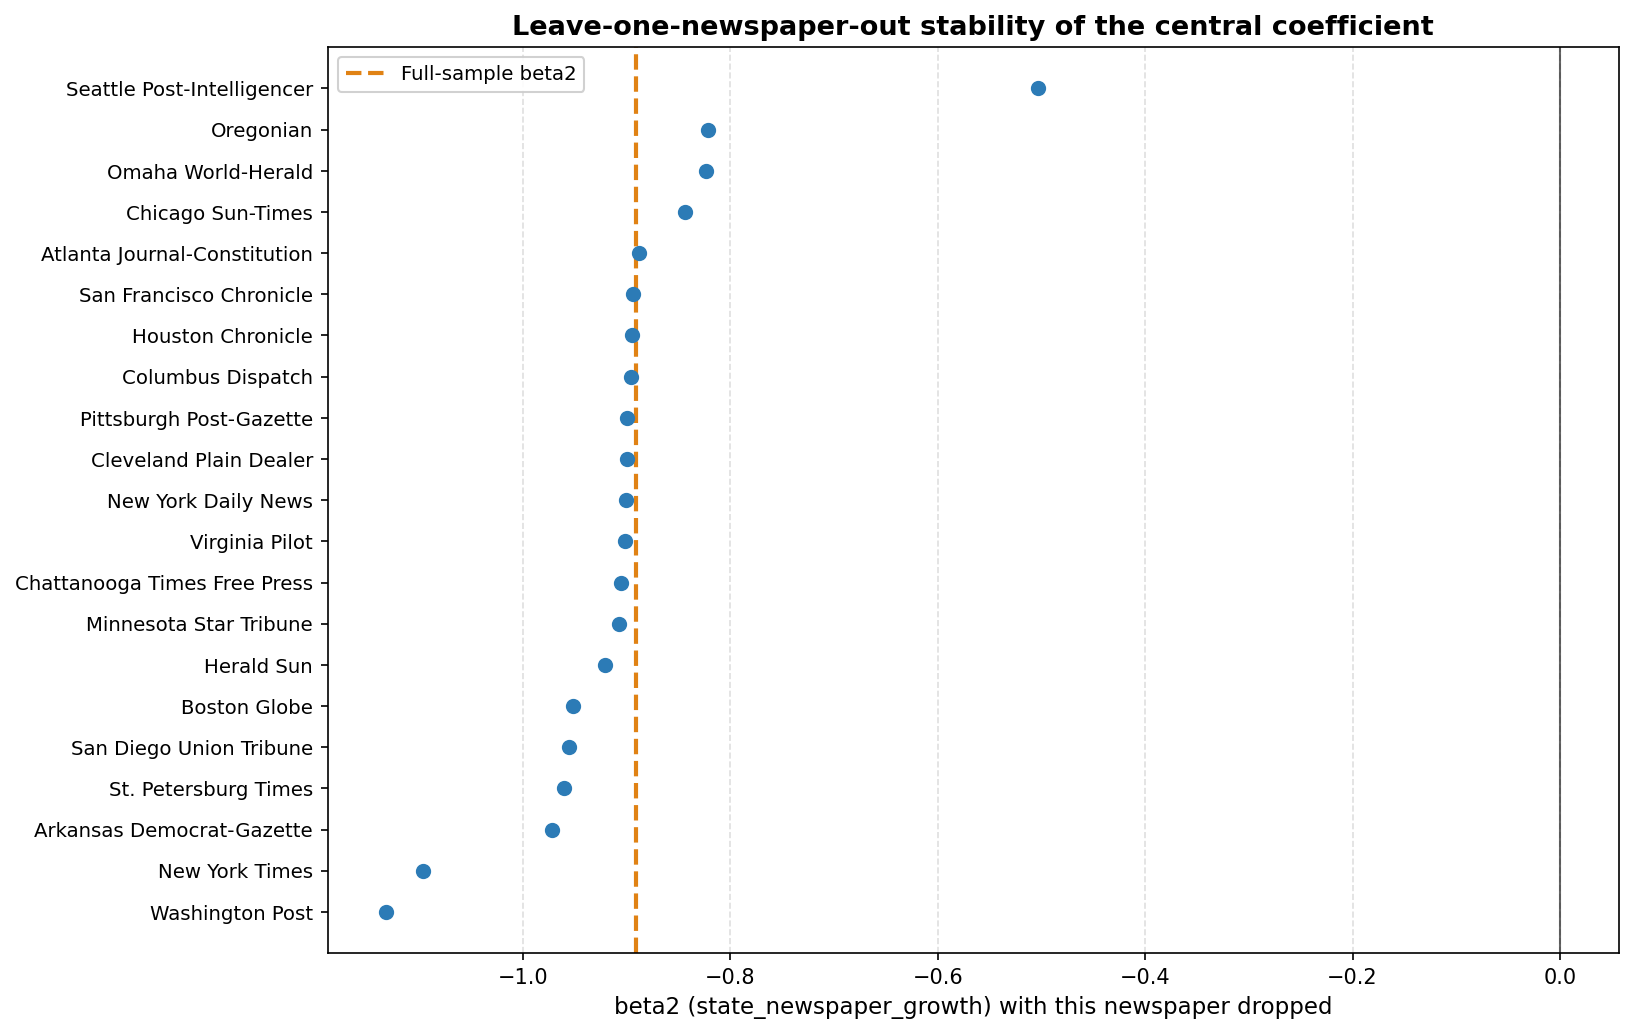
Adding newspaper-specific linear time trends — an important check given that newspaper employment has been declining almost everywhere, which could otherwise manufacture a spurious relationship — leaves the coefficient essentially unchanged (-0.99, p=0.024), if anything slightly larger. Excluding 2008-09 changes little (-0.95). Two newspaper-years sit at a thin-coverage floor (6 months of data) with concern values far outside the normal range; excluding them tightens the estimate to -0.57 (p=0.024) rather than weakening it — those observations were adding noise, not manufacturing the result.
How much of the variation this actually explains. Newspaper and year fixed effects alone already explain 48% of the variance in economic sentiment. Adding both economic variables raises that to 50.3% — journalism-specific growth contributes about 0.3 percentage points of that on its own. The relationship is real and consistent, but it explains a sliver of the total variation, not a large share of it.
Individual newspapers are noisy on their own. Running each newspaper’s own sentiment series against its own journalism growth, with no controls, splits almost evenly — 11 of 21 negative, 10 positive, with wide confidence intervals that mostly cross zero. This isn’t in tension with the pooled, fixed-effects-controlled result above; per-newspaper series only have 10-38 annual observations and no way to net out shared national shocks, so this diagnostic is expected to be noisy regardless of whether the underlying pooled relationship is real.
Within-city comparison. The Times and the New York Daily News share the exact same state labor market, so any difference between them can’t be attributed to state-level conditions. Over their 14 overlapping years, their sentiment series correlate at 0.75 — they move together closely, mostly tracking shared national and New York conditions. Their individual slopes on journalism growth point in opposite directions, but with only two newspapers this is a diagnostic, not a test.
Small-sample caveats. With ~21 newspaper clusters, conventional clustered p-values shouldn’t be leaned on heavily — that’s why effect sizes, leave-one-out stability, and the timing check carry more weight in the interpretation above than the p-values alone would justify.
Reproducing this analysis
Code and data are in the newspaper-hometown-economy repository, including the newspaper-to-geography crosswalk, the full regression sequence, and a findings.md write-up of what’s robust and what isn’t.
Dependencies
pip install pandas requests statsmodels linearmodels matplotlib rdata
Data
QCEW and FRED data are downloaded by script; the Hopkins et al. replication files are checked into the repository directly.
Related: Have our expectations outpaced economic growth? asks the broader question this mechanism speaks to: why measured wellbeing has diverged from measured economic conditions.
Related: US happiness has fallen to record lows documents the wellbeing decline that a more negative news environment could plausibly be one input into.