Have our expectations outpaced economic growth?
Self-reported happiness and well-being has noticeably declined in the United States, and was near all-time lows as of 2024-2025. This is despite the fact that economic statistics are reasonably healthy - certainly not near all-time lows. Indeed, the country is by some measures richer than it has ever been (and much of that wealth is broadly shared).
So what’s going on?
One possible explanation is the old notion that “happiness is expectations minus reality.” If economic conditions have improved, but our expectations have outpaced the growth rate, that could lead to dissatisfaction with even very good economic outcomes.
To assess this, this post uses fifty years of data from the General Social Survey (GSS). The GSS has asked Americans about their happiness and financial satisfaction every year or two since 1972, making it an unusually long window into how people’s inner lives have tracked their material circumstances. It includes two questions that get at perceived financial wellbeing from different angles.
finrela asks: Compared with American families in general, would you say your family income is…? The options run from “far below average” to “far above average.” This is a relative measure — it captures where you think you stand in the income distribution.
satfin asks: How satisfied are you with your present financial situation? Respondents choose between “pretty well satisfied,” “more or less satisfied,” and “not satisfied at all.” This is an absolute measure — it reflects how you feel about your own situation, regardless of how others are doing.
The question I’m interested in is how people at different income levels perceive their financial situation, and how these perceptions have evolved over time. I will focus on people who report that they are in a bad financial situation: that their financial situation is below/far below average for American families in general, or that are not satisfied at all with their financial situation. Specifically, I am going to focus on the level of household income where people tell the GSS that they are in a bad financial situation at 25% of the time.
The methodology
To implement that, for each survey year, I fit a logistic regression of the probability of reporting a bad financial situation on the logarithm of household income adjusted for household size (so people who have the same household income but more people living in the household have a lower adjusted income). I use the OECD square-root equivalence scale - read more here. In general, the regressions show the more income a respondent reports, the less likely they are to report a bad financial outcome. I have a different logistic regression for every year in which there is a survey.
With the logistic regression, I can find the adjusted income level for a respondent where they report a bad financial situation exactly 25% of the time. This is the number I want to track over time. Specifically, this should be interpreted as a threshold - people who report an adjusted household income below this level are more than 25% likely to report a bad financial situation, and people who report an income above it are less than 25% likely to report a bad financial situation. It’s a noisy series, so income is smoothed with a ±2 calendar year centred window.
One important caveat: the GSS income variable is derived from categorical brackets, and the top bracket captures a growing share of respondents over time (roughly 3% in 1972, rising to 15% by 2024). This top-coding attenuates measured income growth and can distort the logistic regression slope. This is another reason I focus on bad financial situations, rather than good ones: we more precisely observe the incomes of people who are below the top category, and these are the people more likely to report bad financial situations.
Perceptions that your income is below average
The first chart uses finrela. The threshold here is the income at which there is a 25% chance of describing one’s income as “below average” or “far below average.” In red, we see the imputed income level where one perceives oneself to be below or far below average with 25% probability. In blue, we have the actual median income of survey respondents.
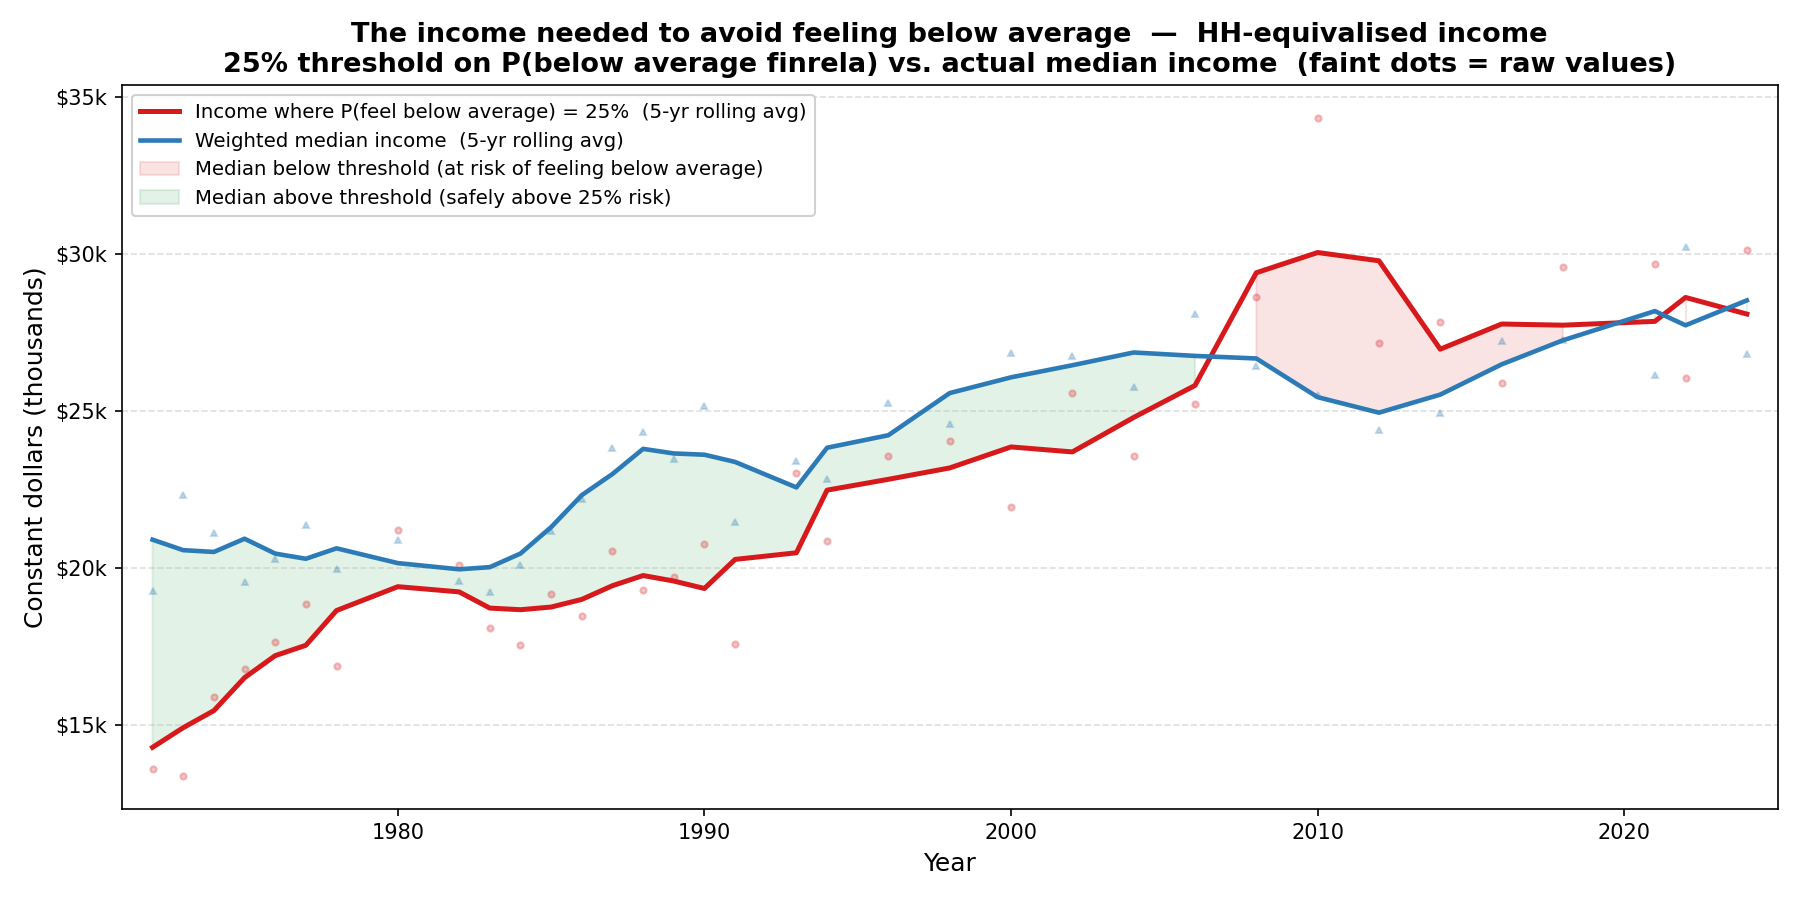
Income needed for less than a 25% chance of feeling “below average” on finrela, vs. actual median equivalised household income. Red shading indicates years in which the median household falls below the imputed threshold income level.
Between the 1970s through the mid-2000s, the two lines rise roughly in parallel. Household incomes grow, and the income level at which people start to worry they are falling behind rises with it. But then, in the mid-2000s, around the onset of the global financial crisis, this relationship changes. From then on, the income level at which people start worrying they are falling behind actually rises above the income of the median respondent. People who are making average income start to report that they believe they are making below or far below average income.
Satisfaction with financial situation
The second chart uses satfin. For each year, the red line shows the equivalised household income at which there is a 25% chance of reporting “not satisfied at all” with one’s financial situation. The blue line shows the actual weighted median equivalised income of GSS respondents.
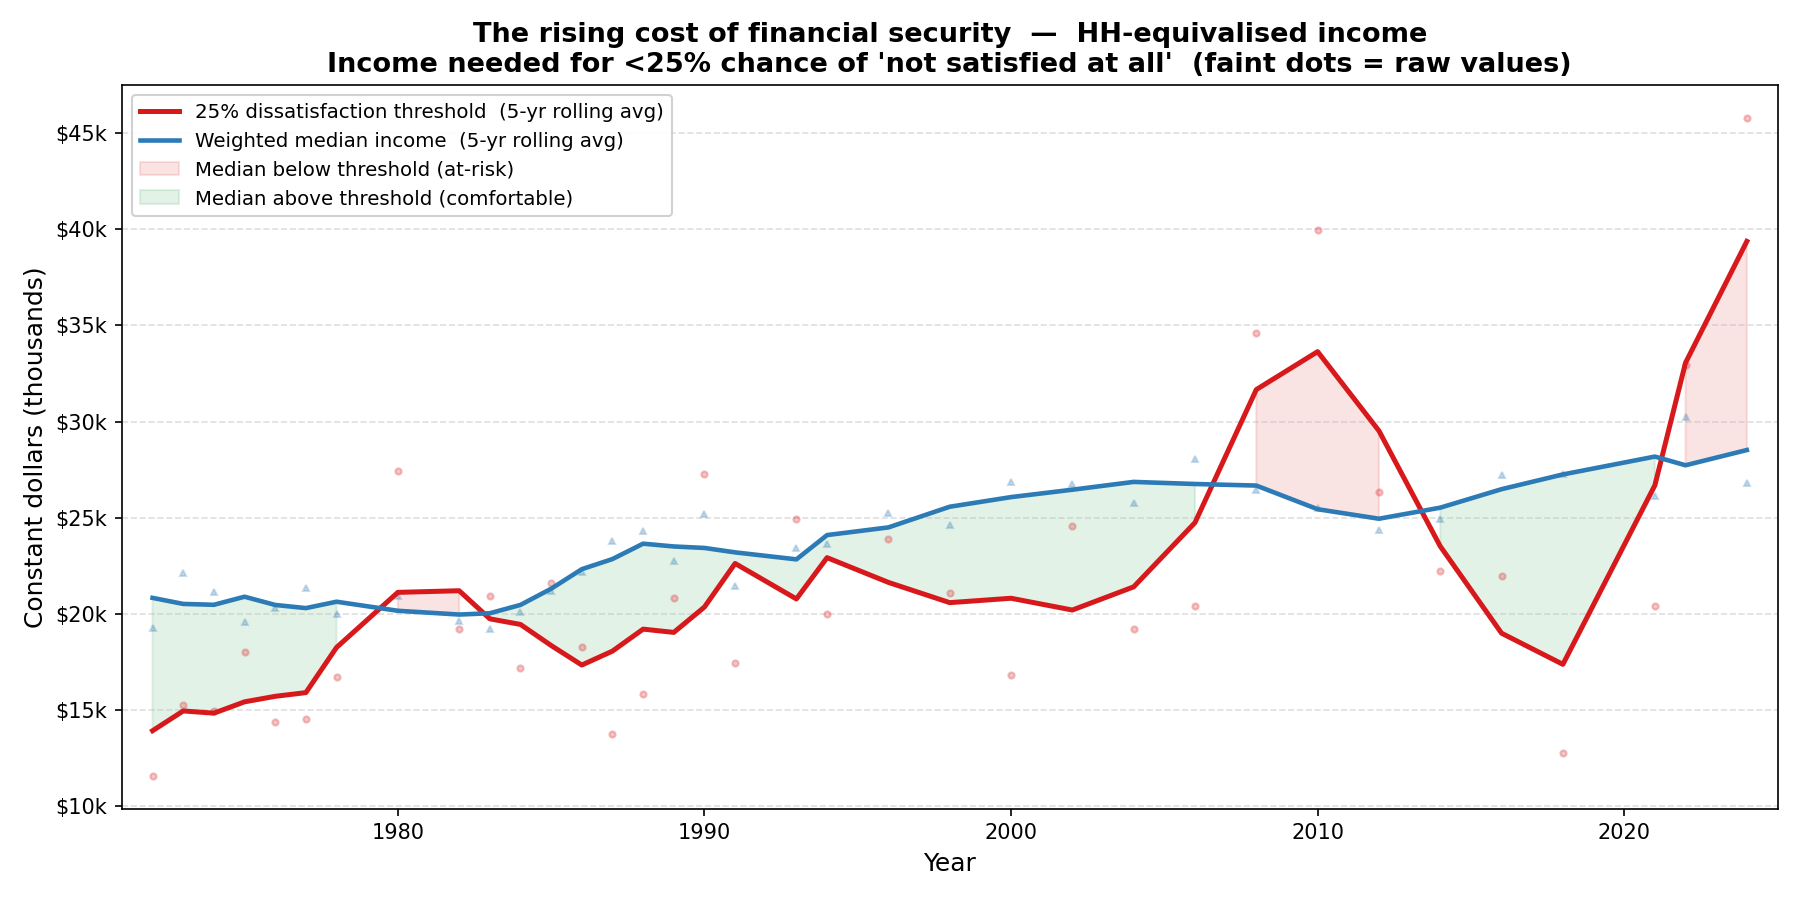
Income needed for less than a 25% chance of financial dissatisfaction, vs. actual median equivalised household income. Red shading indicates years in which the median household falls below the imputed threshold income.
Between the 1970s and mid-2000s, the two lines mostly rise together at a similar rate. One interpretation is that, as incomes rise, the level of income at which you become satisfied with your level of income also rises. In other words, there is a kind of hedonic treadmill effect, where greater prosperity leads to greater expectations. In the mid-2000s, this relationship breaks down though, and we start to see large swings in the imputed income level at which a respondent starts to report they are not at all satisfied with their financial situation. Following the global financial crisis, the level of income where people start to report dissatisfaction is well above the median income for survey respondents. This reverses for a period, but in the latest data we have, once again the income level at which people begin to report dissatisfaction with their income is way above the median reported income.
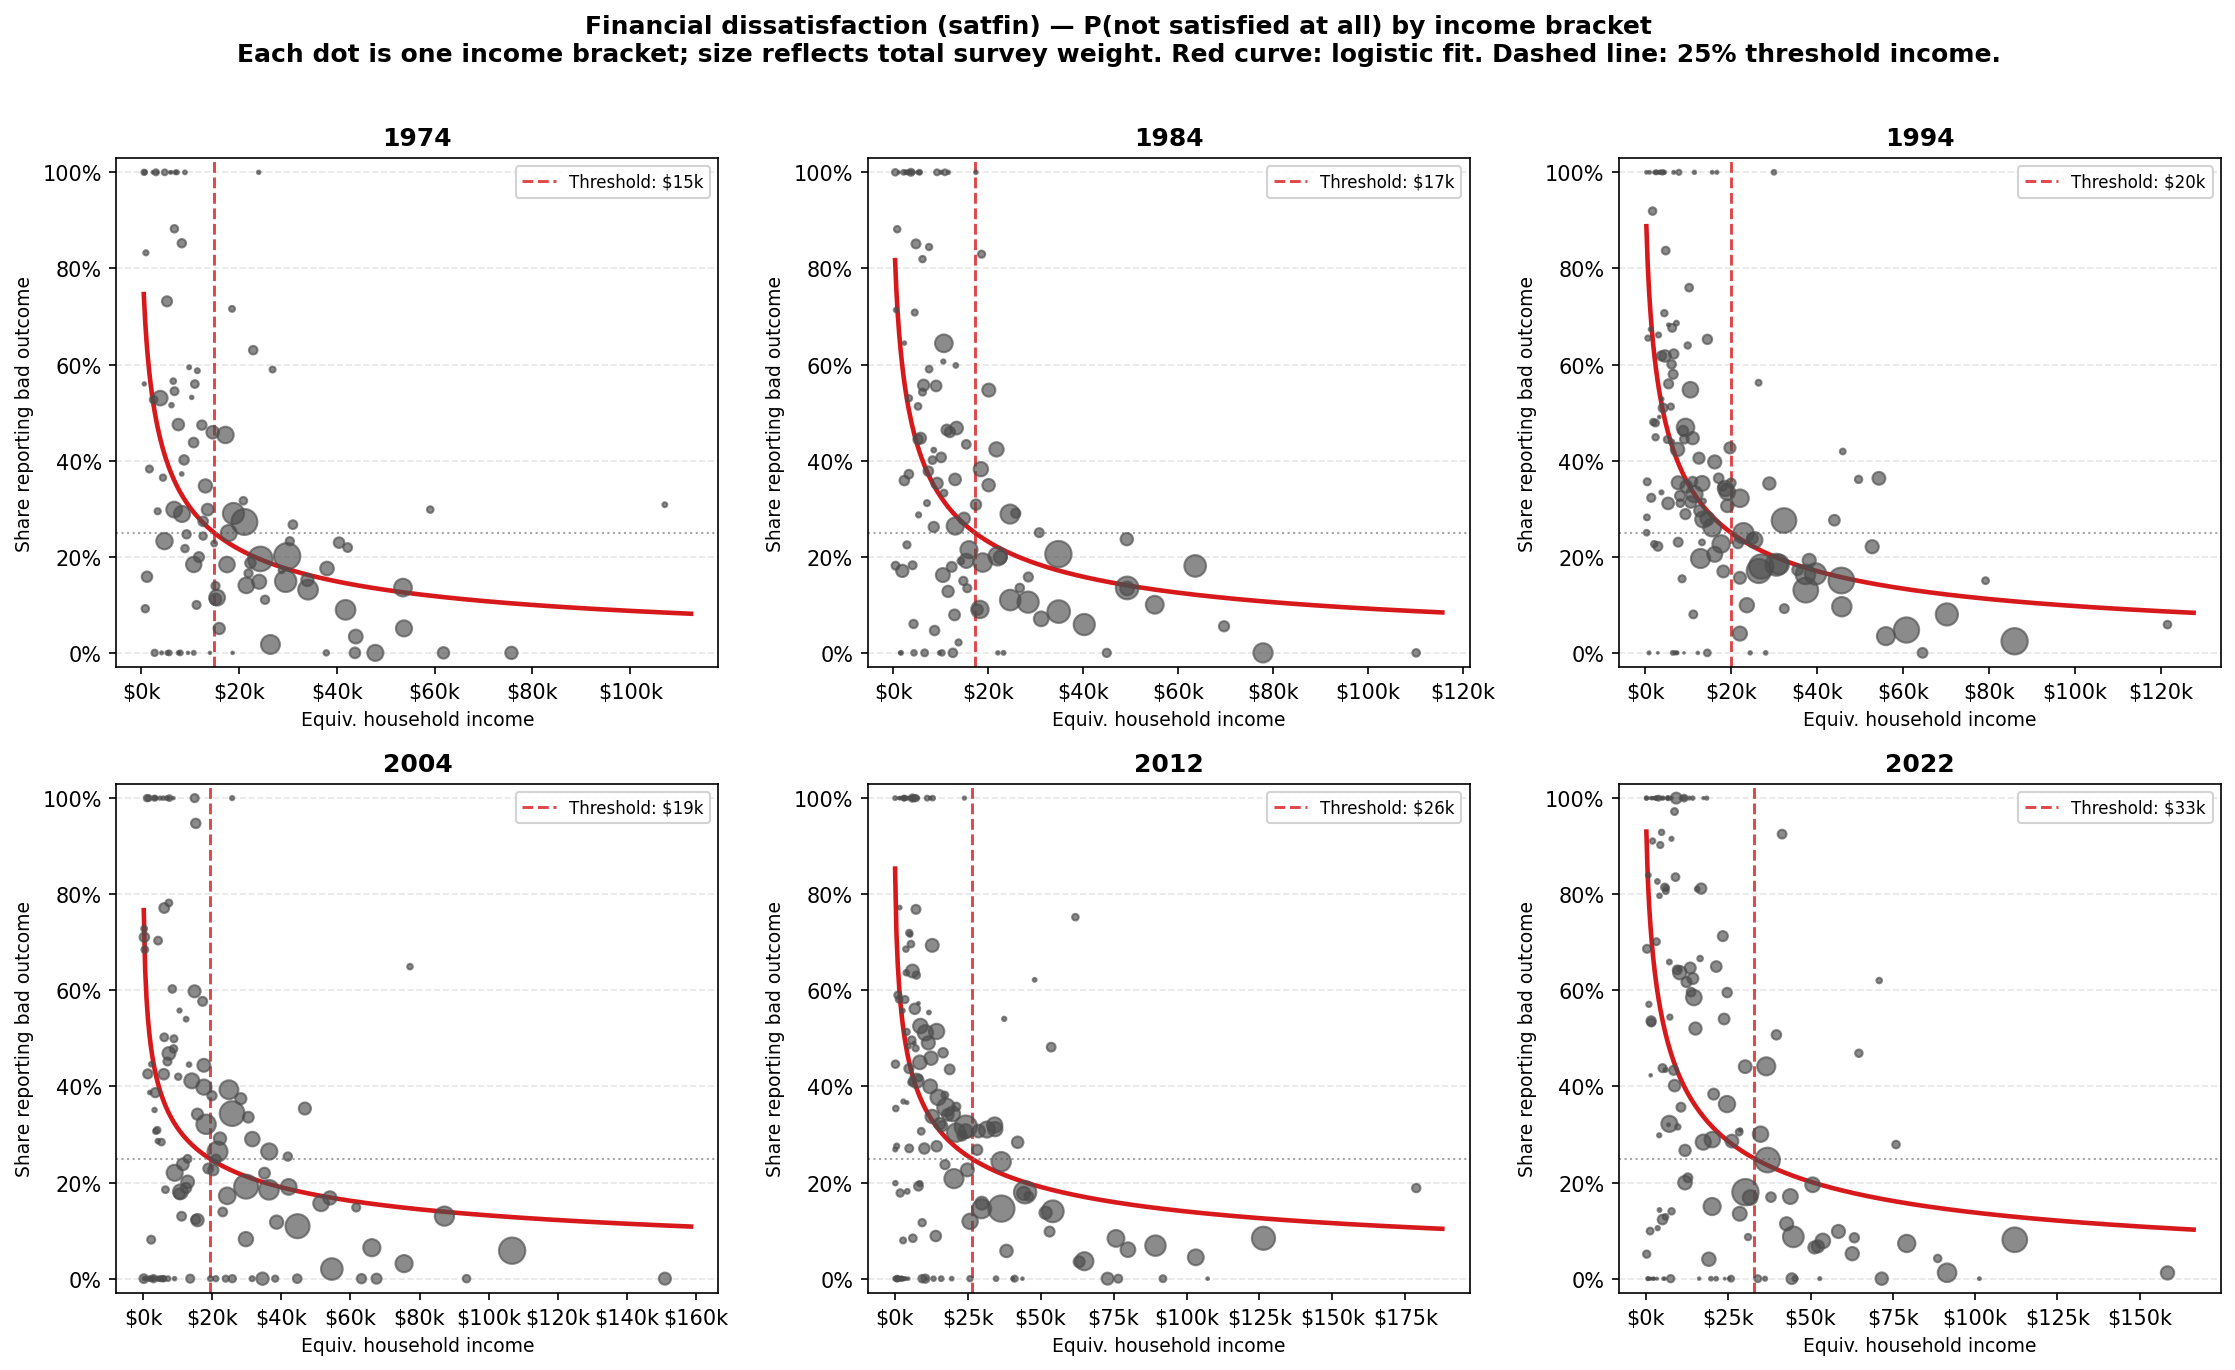
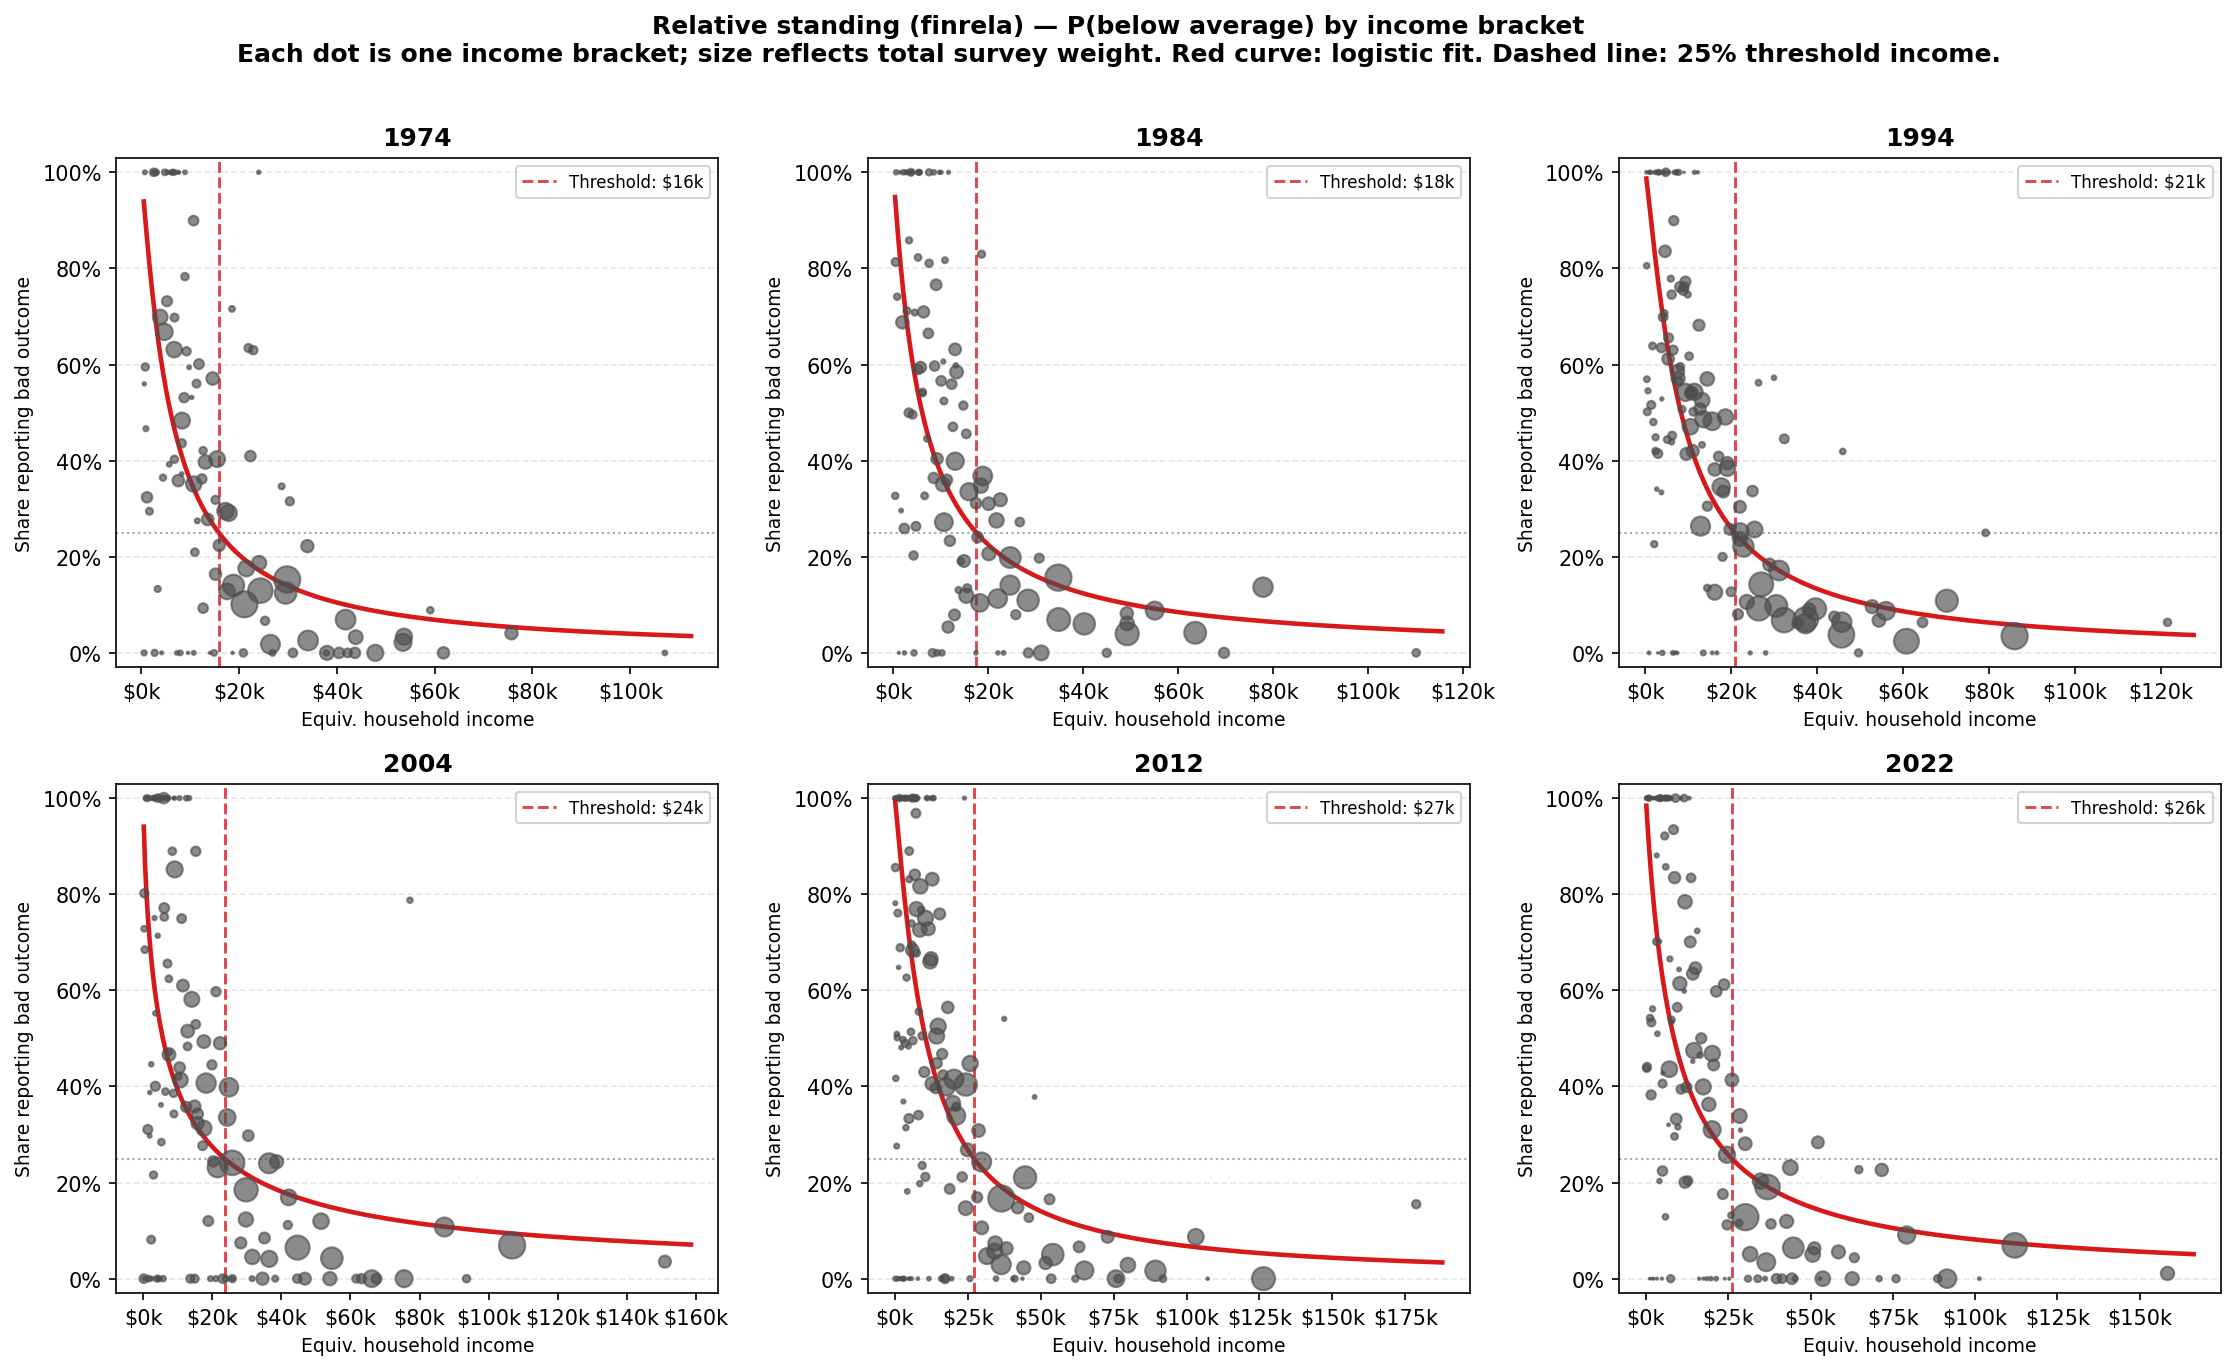
Under the hood: the logistic regression
For each survey year, the threshold is estimated by fitting a logistic regression
to the raw survey responses and reading off where the fitted curve crosses 25%.
The charts below show what that looks like for six anchor years.
Each dot is one income bracket — its horizontal position is the bracket midpoint
(adjusted for household size), its vertical position is the weighted share of
respondents in that bracket who reported the bad outcome, and its size is
proportional to the total survey weight in that bracket. The red curve is the
fitted logistic regression; the dashed line marks the 25% threshold income.
Financial dissatisfaction (satfin)
Relative standing (finrela)
Reproducing this analysis
The full code is in the gss-financial-situation-thresholds repository.
Data
The GSS data is not included in the repository. Download your own extract from GSS Data Explorer with these variables:
| Variable | Description |
|---|---|
satfin |
Satisfaction with financial situation (3 categories) |
happy |
General happiness (3 categories) |
finrela |
Opinion of family income relative to others (5 categories) |
coninc |
Family income in constant dollars (top-coded bracket midpoints) |
hompop |
Number of people in household |
wtssps |
Post-stratification survey weight |
Save the file as data/GSS.xlsx in the project root. Note that wtssps must be added explicitly — it is not included in GSS extracts by default.
Dependencies
pip install pandas openpyxl scikit-learn matplotlib statsmodels
Python 3.9+.
Generating the charts
The two charts in this post are produced by:
python3 gss_threshold.py       # financial dissatisfaction threshold (satfin)
python3 gss_finrela_worst.py   # relative standing threshold (finrela)
Output is saved to output/threshold/threshold_adjusted.png and output/finrela_worst/threshold_adjusted.png respectively. Run all scripts from the project root.
Related: Feeling Below Average at the Median takes a complementary approach — instead of modelling a threshold, it directly measures the share of median-income respondents who report feeling below average, and finds the same post-2008 deterioration.
Related: US happiness has fallen to record lows documents the broader decline in American wellbeing across the GSS happiness question, the World Happiness Report Cantril ladder, and Gallup’s wellbeing index.
Related: Who Is Unhappy in America? breaks the finrela and satfin trends down by age group, showing that young Americans have driven the long-run deterioration in perceived relative financial position.
Data: General Social Survey, NORC at the University of Chicago, 1972–2024. Income adjusted to constant dollars and equivalised for household size (OECD square-root scale). Survey weights (wtssps) applied throughout.