The Economics Job Market Since 1974
Drafted by Claude Code from an analysis I directed and reviewed.
The number of positions advertised on the AEA’s Job Openings for Economists (JOE) board has declined in four of the six years since its 2018 peak. The 2025 academic year ended with 1,122 postings — near the COVID-year low of 1,074 recorded in 2020.
Annual postings, 2015–2025
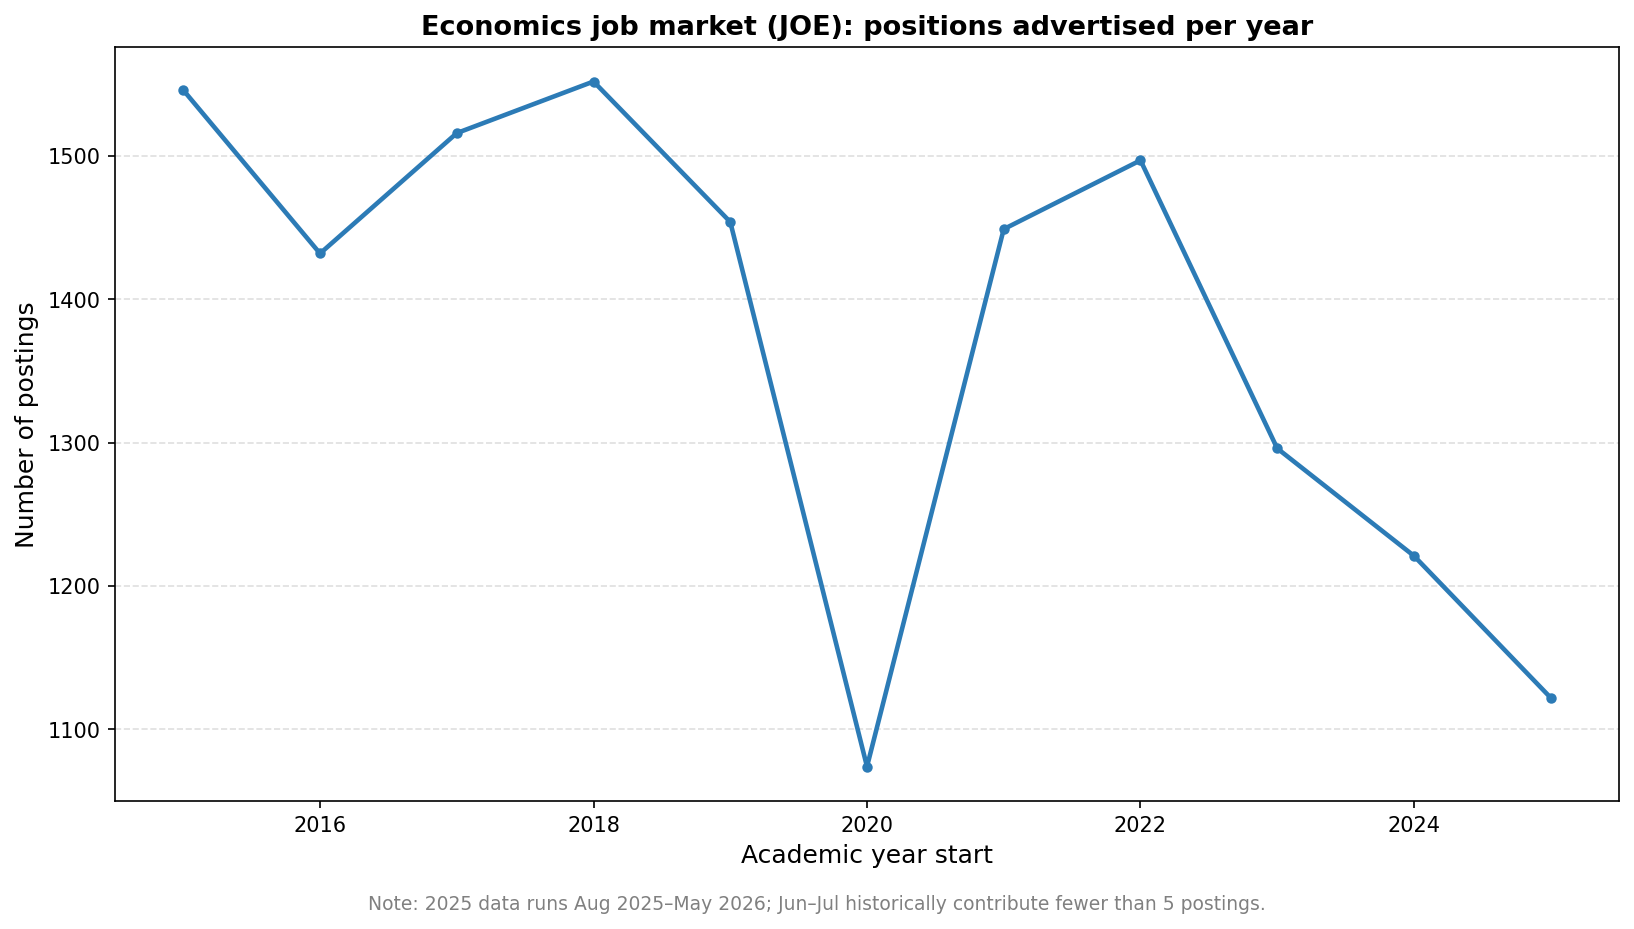
From 2015 to 2018 postings ranged between 1,432 and 1,552, peaking at 1,552 in 2018. The 2020 academic year (the first to show the effects of the pandemic on hiring) dropped sharply to 1,074. The market partially recovered to 1,449–1,497 in 2021–2022 before declining again each year: 1,296 in 2023, 1,221 in 2024, and 1,122 in 2025. The 2025 value sits near the COVID trough and is roughly 28% below the 2018 peak.
Note: 2025 data runs August 2025–May 2026. June and July historically contribute fewer than five postings combined.
The longer view, 1974–2025
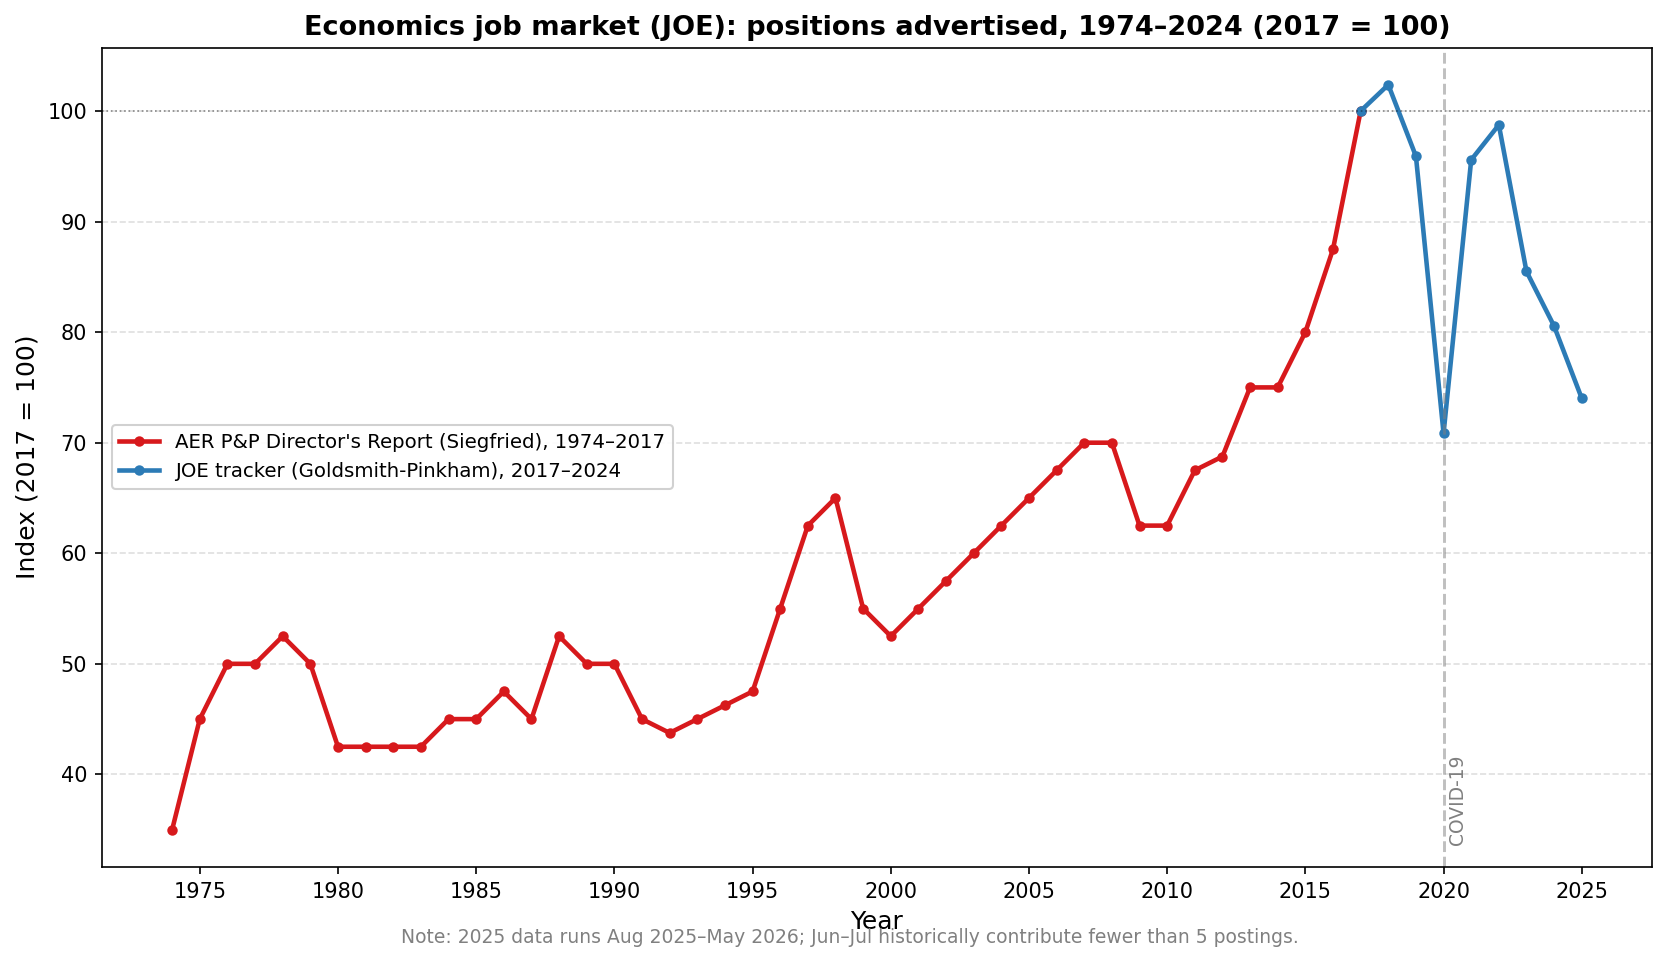
Splicing two data sources and indexing both to 2017 = 100 extends the picture back to 1974. The red series (Cawley 2018) shows the market growing from roughly 35 in 1974 — about a third of its 2017 level — to 100 by 2017, with a notable dip around 1980–1983, a plateau in the 1990s, and accelerating growth after 2012. The blue series (Goldsmith-Pinkham) picks up from 2017 and stands at 74 in 2025 — a 26% decline from the 2017 base, and fractionally above the COVID trough of 71 recorded in 2020.
Two counting methods, one index
The two series count jobs differently and cannot be directly compared in levels. The Cawley series draws on the AEA’s annual Report of the Director of JOE, which counted all unique jobs listed in a given calendar year; the 2017 figure is approximately 4,000. The Goldsmith-Pinkham series scrapes JOE Network listings and deduplicates by posting ID within an academic year (August–July); its 2017 count is approximately 1,516. The roughly 2.6× gap reflects methodological differences — different time windows, deduplication rules, and the 2013 shift from monthly JOE issues to continuous posting — not a discrepancy in the underlying job market. Indexing both series to their respective 2017 values eliminates the level difference and leaves only the relative trend, which is what the chart shows.
Data
This post builds on two sources I am grateful to their authors for making available.
The historical series comes from John Cawley’s “A Guide and Advice for Economists on the U.S. Junior Academic Job Market” (2018 edition), specifically Figure 2, which plots unique JOE listings from 1974 to 2017. Cawley in turn draws on the Report of the Director of Job Openings for Economists compiled by John Siegfried and published annually in the AEA Papers and Proceedings.
The modern series comes from Paul Goldsmith-Pinkham’s JOE tracker, which scrapes JOE Network listings and makes annual Excel files publicly available on GitHub. The tracker covers 2015–2024 in his published files. For the 2025 academic year (August 2025–May 2026), Paul’s most recent export ran only through October 2025, so I downloaded fresh exports directly from the JOE Network website to fill in November 2025–May 2026, then merged and deduplicated the files by posting ID.
| Source | Coverage |
|---|---|
| Cawley (2018), Figure 2 | 1974–2017; hand-digitized; original data from Siegfried (2018), AER P&P |
| Goldsmith-Pinkham JOE tracker | 2015–2024; scraped JOE Network listings, deduplicated by jp_id |
| JOE Network direct exports | 2025 (Aug 2025–May 2026); merged with Goldsmith-Pinkham files |
Reproducing this analysis
Code and data are in the economics-job-market repository.
Dependencies
pip install pandas matplotlib openpyxl